Research Article
Detection of Ganglion Cell Loss in Preperimetric Glaucoma by Fourier-Domain Optical Coherence Tomography

Suneeta Dubey*, Baswati Prasanth, Lokesh Chauhan and Saptarshi Mukherjee
Dr. Shroff’s Charity Eye Hospital Daryaganj, New Delhi, India
*Address for Correspondence: Dr. Suneeta Dubey, Head-Glaucoma Services, Dr. Shroff’s Charity Eye Hospital, New Delhi, India, Tel: (+91) 9818224290; Email: [email protected]; [email protected]
Dates: Submitted: 12 October 2017; Approved: 23 October 2017; Published: 24 October 2017
How to cite this article: Dubey S, Prasanth B, Chauhan L, Mukherjee S. Detection of Ganglion Cell Loss in Preperimetric Glaucoma by Fourier-Domain Optical Coherence Tomography. Int J Clin Exp Ophthalmol. 2017; 1: 042-048. DOI: 10.29328/journal.ijceo.1001006
Copyright Licence: © 2017 Dubey S, et al. This is an open access article distributed under the Creative Commons Attribution License, which permits unrestricted use, distribution, and reproduction in any medium, provided the original work is properly cited.
Abstract
Background: Glaucoma is a multi-factorial optic neuropathy characterized by a loss of retinal ganglion cells with subsequent loss of the retinal nerve fibers ultimately resulting in visual impairment. The macula region has a high density of retinal ganglion cells thereby being a likely region to detect early cell loss .Since glaucoma affects mainly the inner layers of the retina, Ganglion Cell Complex (GCC) mapping can help to detect glaucomatous damage early as compared to the total retinal thickness.
Purpose: To map GCC thickness and average Macular Retinal (MR) thickness with high-speed Fourier-Domain Optical Coherence Tomography (FD-OCT) and correlate it with the Retinal Nerve fiber layer (RNFL) thickness in preperimetric glaucoma.
Design: Observational cross-sectional study.
Methods: Forty four eyes diagnosed as preperimetric glaucoma were studied. GCC, MR thickness and RNFL thickness was mapped using the RTVue FD-OCT system. The GCC thickness map, the deviation map and the significance map were obtained in all cases. Average GCC thickness and MR thickness were correlated with the RNFL thickness.
Results: Average GCC of patients was 85.99±6.9 µm. There was GCC loss in 35 (87.5%) eyes which correlated well with areas of RNFL loss (r=0.408, p<0.001). Nine (22.5%) eyes were seen to have decreased MR thickness. GCC loss correlated well with the loss of average RNFL thickness and MR thickness. Further GCC loss was also seen in 23 (74.19 %) eyes with a normal MR thickness.
Conclusion: GCC analysis may prove to be a robust diagnostic parameter and is complementary to RNFL analysis in preperimetric glaucoma.
Introduction
Glaucomatous optic neuropathy is a chronic process which progresses over many years. The definite pattern of visual field loss that occurs in glaucoma is suggestive of the fact that the retinal ganglion cell (RGC) death which is the final pathway of glaucomatous optic nerve damage doesn’t occur at the same time but varies between months to years [1]. It seems therefore reasonable to assume that when a patient is diagnosed initially as having glaucoma, only some ganglion cells are dead, whereas others may range from being unhealthy to being perfectly normal [2]. The structural damage to the RGC is characterized by changes in the optic disc in the form of thinning of neuroretinal rim, pallor and progressive cupping of the optic disc. Disc hemorrhages with associated retinal nerve fiber layer (RNFL) defects precede measurable changes of the optic disc configuration [3]. The functional changes accompanying the structural damage includes a definite pattern of visual field defects. Unfortunately, in glaucoma the structural changes precedes the functional damage and field changes are often detected only after 40% of the axons are lost [4]. The inability to pick up retinal ganglion cell loss on clinical examination and the rare documentation of the RNFL defects using red-free fundus photography has validated the use of new software to determine the ganglion cell layer thickness. The macula region contains over 50% of all retinal ganglion cells and is likely an ideal region to detect early cell loss and changes over time because of the high density of cells. Reduced macular thickness in glaucoma was initially described by Zeimer using the slit-scanning Retinal Thickness Analyzer [5]. Since the introduction of optical coherence tomography (OCT) by Huang, it has proven useful for measuring circumpapillary RNFL thickness for glaucoma detection [6]. However, macular retinal (MR) thickness measurement using OCT has not been nearly as accurate a diagnostic parameter as Nerve Fibre Layer (NFL) [7]. Glaucoma preferentially affects the innermost retinal layers: the nerve fiber, ganglion cell, and inner plexiform layers collectively referred to as the ganglion cell complex (GCC) which contain, respectively, the axons, cell bodies and dendrites of the ganglion cells. It thus seems reasonable to target these layers using a Fourier domain OCT (FD-OCT) system, which by virtue of its high speed and increased depth resolution facilitates delineation of GCC from the rest of retina.
Materials and Methods
Study design
Observation cross-sectional study
Inclusion criteria
Consecutive patients reporting for routine evaluation and diagnosed as preperimetric glaucoma on the basis of a Cup Disc (CD) ratio >0.5 with diffuse or localized rim thinning, disc hemorrhage, vertical cup-to-disc ratio greater than the fellow eye by >0.2 or notch in the rim detected on baseline dilated fundus examination, intraocular pressure ≥21 mmHg, with normal Humphrey Swedish Interactive Threshold Algorithm (SITA) 24-2 standard Visual Field (mean deviation and pattern standard deviation within 95% limits of the normal reference and a glaucoma hemifield test within 97% limits), a central corneal thickness ≥500 µm, open anterior chamber angle by gonioscopy and an average RNFL less than 100 µm were included.
Exclusion criteria
Patients already diagnosed as glaucoma and on treatment for glaucoma, history of undergoing any laser surgery, history of chronic ocular or systemic corticosteroid use were excluded from the study. Patients with a visual acuity <20/40, age <18 years and >80 years, diabetic retinopathy or other diseases that could cause visual field loss or optic disc abnormalities; or previous intraocular surgery other than an uncomplicated cataract extraction with posterior chamber intraocular lens implantation were also excluded from the study. Informed consent was obtained from all participants after discussing the goals of the study and consequences of participation. The study was approved by Institutional review board of Dr Shroff’s Charity Eye Hospital.
All Patients underwent a complete anterior segment evaluation, intraocular pressure measurement using Goldman Applanation tonometer (GAT), gonioscopy using 4 mirror gonioscope (Posners 4 Mirror) and optic disc evaluation using 90 Dioptre(D) lens. All patients underwent perimetry using the Humphrey’s Perimeter (24-2 SITA Standard) and were scanned using the RTVue FD-OCT system (Optovue Inc., Fremont, CA, Version 3). With the FD-OCT, RNFL thickness, MR thickness, GCC thickness map, the deviation map and the significance map were obtained. Photographer rejected scans with motion artifacts, segmentation error and Signal Strength Index (SSI) <35 during imaging session and took more scans to satisfy the criteria.
The GCC thickness map represents absolute GCC thickness in the perifoveal area. The deviation map displays acquired signal deviation from the normative database as a fraction of the mean normative value for each acquired pixel. The significance map displays the corresponding probabilities of deviation from the normal range for each acquired pixel in the GCC map. GCC scan was determined using the Manual Measurement 7 (MM7) scan which obtained one horizontal line with a 7mm scan length followed by 15 vertical lines with a 7mm scan length and a 0.5mm interval, centered one millimeter temporal to fovea. MR thickness was obtained from the MM5 scan which obtained 11 horizontal lines with 5mm scan length and 0.5mm interval, 6 horizontal lines with 3mm scan length and 0.5mm interval, 11 vertical lines with 5mm scan length and 0.5mm interval, 6 vertical lines with 3mm scan length and 0.5mm interval, all centered at fovea. The RNFL thickness was determined by the nerve head map 4 mm diameter (NHM4) mode, which measures RNFL thickness by recalculating data along a 3.45 mm diameter circle around the optic disc using a map created from en face imaging utilizing 6 circular scans ranging from 2.5 to 4.0mm in diameter (587 or 775 A scans each) and 12 linear data inputs (3.4 mm length, 452 A scans each).
Results
Forty four eyes of 30 patients were enrolled in the study. Nineteen (64%) patients were male and 11 (36%) patients were female. Mean age of patients was 47.41±14.03 years. Mean IOP was 17.6±5.8 mmHg (Table1). RNFL average, RNFL inferior, RNFL superior, GCC average, GCC inferior, GCC superior and macular thickness were selected as variables of interest (Table 2). Descriptive analysis was performed for all variables.
| Table 1: Characteristics of the study Population | |
| No. of participants | 30 |
| No. of eyes | 44 |
| Age (yrs) | 47.41±14.03 |
| Male (%) | 63.33 |
| MD (dB) | -0.7±1.5 |
| PSD (dB) | 1.6±0.9 |
| IOP (mmHg) | 17.6±5.8 |
| CCT( µm) | 542±38.4 |
| Table 2: The Distribution of Diagnostic Parameters | |||||
| S.No | Variable | Mean | Median | Standard Deviation | Range |
| 1 | RNFL average | 94.26 | 94.89 | 10.14 | 73.54 to 117.5 |
| 2 | RNFL inferior | 117.36 | 123.50 | 23.16 | 29 to 149 |
| 3 | RNFL superior | 115.34 | 114.50 | 19.32 | 79 to 164 |
| 4 | GCC average | 85.99 | 85.95 | 6.97 | 71.04 to 98.78 |
| 5 | GCC inferior | 85.40 | 84.85 | 9.03 | 67.12 to 103.41 |
| 6 | GCC superior | 86.47 | 87.15 | 6.44 | 72.96 to 98.78 |
| 7 | Macular thickness | 232.01 | 232.45 | 15.40 | 197.30 to 260.4 |
Statistical Analysis
Statistical analysis was performed using Pearson correlation test between different variables. There was a positive correlation between RNFL average and GCC average (r=0.61, p<0.0001 with a R2=0.372), RNFL inferior and GCC inferior (r=0.52, p=0.0003 with a R2=0.271) and between GCC average and macular thickness (r=0.59, p<0.0001 with a R2=0.348) (Figures 1-3]. There was no significant correlation between RNFL superior and GCC superior (r=0.18, p=0.22) (Figure 4).
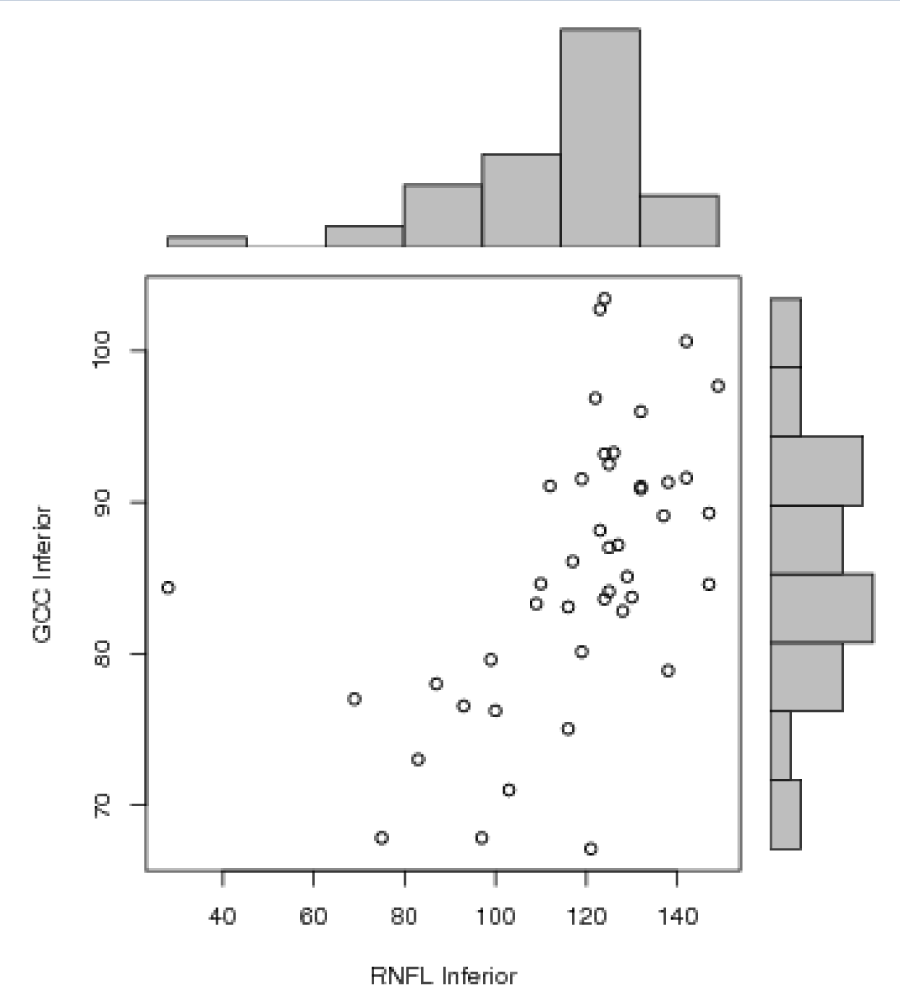
Figure 1:
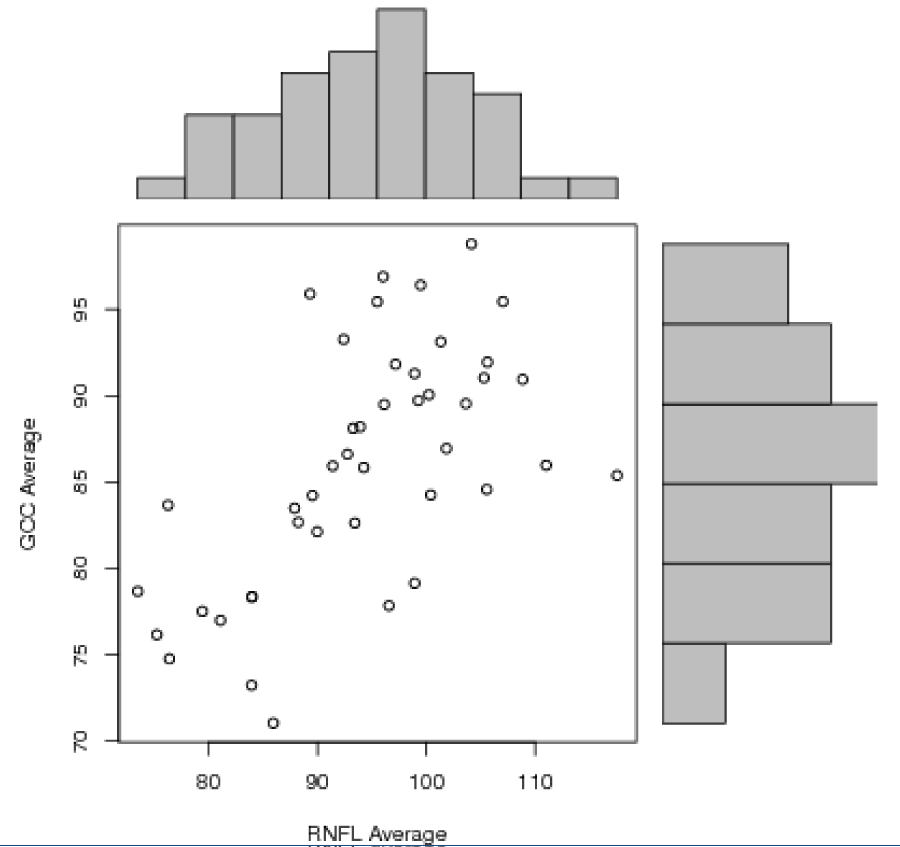
Figure 2:
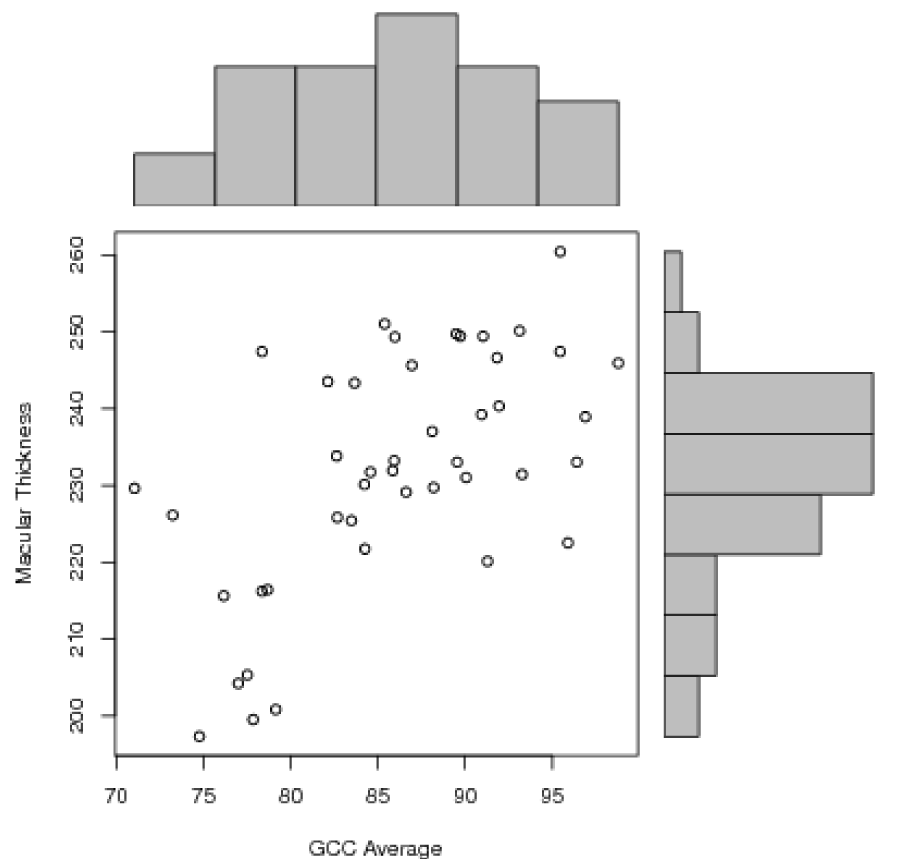
Figure 3:
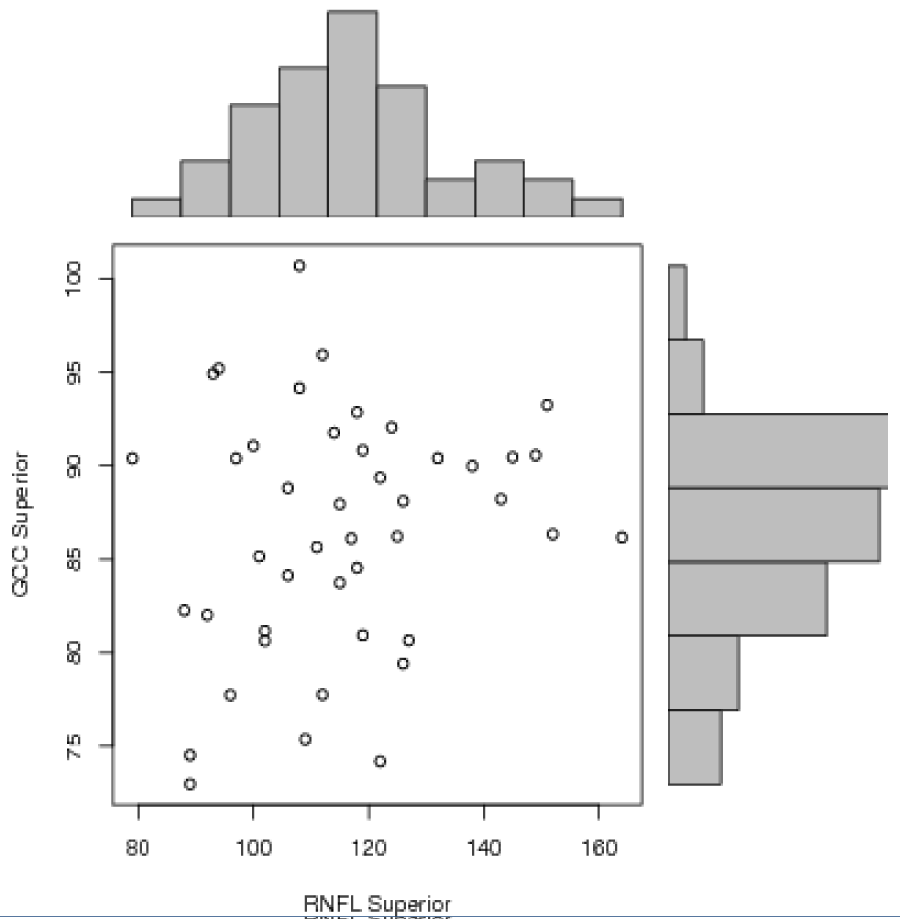
Figure 4:
Discussion
Glaucoma though clinically defined as optic disc cupping with corresponding visual field defects, the pathophysiology of the disease process lies in the ultimate loss of retinal ganglion cells (RGC) [8]. Several studies have shown that macular thickness is significantly reduced in glaucomatous eyes when compared to normal eyes [9,10]. The reduced macular thickness in glaucomatous eyes is attributed mainly to RGC and NFL loss [11]. Reduced macular thickness in glaucoma was initially described by Zeimer using the slit-scanning Retinal Thickness Analyzer [5]. However, the total MR thickness measurement using OCT initially has not been nearly as accurate a diagnostic parameter as NFL. Our study also confirmed that MR thickness was a less accurate parameter for early glaucoma detection than GCC thickness with 87.5% showing loss in GCC maps as compared to only nine eyes (22.5%) showing a reduction in the MR thickness. Other investigators, including Wollstein, Guedes and Medeiros have found MR thickness to be less reliable in early diagnosis and have reported higher Area under ROC curve (AUC) values for NFL when compared to MR thickness using Stratus OCT for glaucoma detection [12,13]. The ganglion cell and nerve fiber layers contribute 30% to 35% of the retinal macular thickness, where the ganglion cells are known to be most concentrated. This means that 65% to 70% of the macular thickness still remains unchanged when comparing normal and glaucomatous eyes. Therefore, to improve the discriminating power, the macular layers can be more finely divided so that only those layers which are affected by glaucomatous damage are measured. Ishikawa and colleagues developed a software algorithm to perform automatic retinal layer segmentation in the macula for the commercially available Stratus Time Domain OCT (TD-OCT) and reported that macular inner retinal layer thickness measurements could indeed be used to discriminate normal from glaucomatous eyes [14]. They found that the outer retinal layers were not affected in glaucoma. However, one of the limitations of the study was variable scan quality. More than one third of their scans on glaucomatous eyes had to be excluded from segmentation analysis owing to poor quality scans related to speckle noise and uneven tissue reflectivity. The authors suggested that higher resolution and improved signal quality (higher signal-to-noise ratio), as provided by FD-OCT, may be needed for better quality image acquisition to allow accurate retinal layer segmentation.
Leung used the Stratus TD-OCT to evaluate macular NFL thinning in glaucoma using the 3.4mm diameter circular scan pattern (fast RNFL scan) [16]. They reported a reduction in macular NFL thickness in glaucomatous eyes compared with normal eyes. However, they found that measurement of macular NFL thickness offered no advantage over measurement of total macular thickness for glaucoma detection. In their study, circumpapillary NFL thickness outperformed macular NFL and total macular thickness in the ability to detect glaucoma and to correlate with visual function. In contrast Greenfield reported that OCT derived macular thickness correlated well with changes in visual function and RNFL structure in moderately advanced glaucoma. They reported a strong correlation between mean macular thickness and Visual Field Mean Deviation (r2=0.47; p<0.001), and suggested that reduced macular thickness could be a surrogate for loss of RGCs in glaucoma [16].
Tan and colleagues [17] investigated the diagnostic accuracy and reproducibility of novel GCC parameters as measured by the RTVue FD-OCT system compared with the standard peripapillary RNFL thickness measurements obtained with TD-OCT. There are several new reports about the GCC analysis with the RTVue. In one study, Takagiet al showed the GCC analysis significantly detected GCC thinning in eyes with visual field defects in one hemisphere and significantly correlated with the severity of visual field loss [18]. In another study, Mori and colleagues found that the GCC analysis significantly differentiated normal from glaucoma and had an AUC of 0.91. The GCC analysis also significantly correlated with visual field damage [19]. In this study GCC loss was seen in 35 eyes which correlated well with the areas of decreased RNFL thickness (Figure 5). Further, GCC loss was also seen in cases with a normal macular retinal thickness suggesting that RGC loss could probably be picked up earlier by using this modality of scanning. However, long term studies are required before extrapolating the results into future clinical practice.
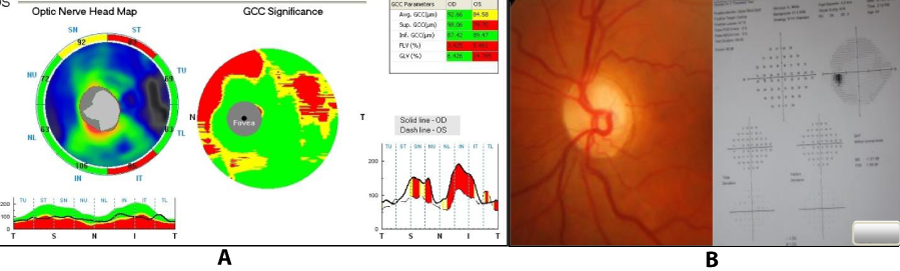
Figure 5: A) GCC scan showing corresponding areas of loss as in RNFL map in a preperimetric glaucoma patient. B) Optic disc and visual fields of the same patient.
Conclusion
In this study, good correlation and agreement was found between GCC loss and RNFL loss in cases of preperimetric glaucoma. These results suggest the ability of the RTVue to detect early glaucomatous structural damage by GCC mapping. Thus, GCC mapping can be considered a surrogate to RNFL loss in preperimetric glaucoma and can be used as an adjunct to RNFL measurement in preperimetric glaucoma.
References
- Osborne NN, Chidlow G, Nash MS, Wood JP. The potential of neuroprotection in glaucoma treatment. Curr Opin Ophthalmol. 1999; 10: 82-92. Ref.: https://goo.gl/RPEigL
- Neufeld AH. New conceptual approaches for pharmacological neuroprotection in glaucomatous neuronal degeneration. J Glaucoma. 1998; 7: 434-438. Ref.: https://goo.gl/Ac457w
- Schuman JS, Hee MR, Puliafito CA, Wong C, Pedut-Kloizman T, et al. Quantification of nerve fiber layer thickness in normal and glaucomatous eyes using optical coherence tomography. Arch Ophthalmol. 1995; 113: 586-596. Ref.: https://goo.gl/rBeZTV
- Mistlberger A, Liebmann JM, Greenfield DS, Pons ME, Hoh ST, et al. Heidelberg retinal tomography and optical coherence tomography in normal, ocular hypertensive and glaucomatous eyes. Ophthalmology. 1999; 106: 2027-2032. Ref.: https://goo.gl/fsUCPP
- Zeimer R, Asrani S, Zou S, Quigley H, Jampel H. Quantitative detection of glaucomatous damage at the posterior pole by retinal thickness mapping: a pilot study. Ophthalmology. 1998; 105: 224-231. Ref.: https://goo.gl/KqHKJ8
- Huang D, Swanson EA, Lin CP, Schuman JS, Stinson WG, et al. Optical Coherence Tomography. Science. 1991; 254: 1178-1181. Ref.: https://goo.gl/WazgmZ
- Bagga H, Greenfield DS, Knighton RW. Macular symmetry testing for glaucoma detection. J Glaucoma. 2005; 14: 358-363. Ref.: https://goo.gl/JVhWb5
- Sommer A, Miller NR, Pollack I, Maumenee AE, George T. The nerve fiber layer in the diagnosis of glaucoma. Arch Ophthalmol. 1977; 95: 2149-2156. Ref.: https://goo.gl/7Pj2T3
- Guedes V, Schuman JS, Hertzmark E, Wollstein G, Correnti A, et al. Optical coherence tomography: measurement of macular and nerve fiber layer thickness in normal and glaucomatous human eyes. Ophthalmology. 2003; 110: 177-189. Ref.: https://goo.gl/9Cx3Py
- Frishman LJ, Shen FF, Du L, Robson JG, Harwerth RS, et al. The scotopic electroretinogram of macaque after retinal ganglion cell loss from experimental glaucoma. Invest Ophthalmol Vis Sci. 1996; 37: 125-141. Ref.: https://goo.gl/Ae6ndt
- Glovinsky Y, Quigley HA, Pease ME. Foveal ganglion cell loss is size dependent in experimental glaucoma. Invest Ophthalmol Vis Sci. 1993; 34: 395-400. Ref.: https://goo.gl/2MTq4x
- Wollstein G, Schuman JS, Price LL, Aydin A, Beaton SA, et al. Optical coherence tomography (OCT) macular and peripapillary retinal nerve fiber layer measurements and automated visual fields. Am J Ophthalmol. 2004; 138: 218-225. Ref.: https://goo.gl/QqoLrQ
- Medeiros FA, Zangwill LM, Bowd C, Vessani RM, Susanna R Jr, et al. Evaluation of retinal nerve fiber layer, optic nerve head and macular thickness measurements for glaucoma detection using optical coherence tomography. Am J Ophthalmol. 2005; 139: 44-55. Ref.: https://goo.gl/XAKuAV
- Ishikawa H, Stein DM, Wollstein G, Beaton S, Fujimoto JG, et al. Macular segmentation with optical coherence tomography. Invest Ophthalmol Vis Sci. 2005; 46: 2012-17. Ref.: https://goo.gl/o6A638
- Leung CK, Chan WM, Yung WH, Ng AC, Woo J, et al. Comparison of macular and peripapillary measurements for the detection of glaucoma: an optical coherence tomography study. Ophthalmology. 2005; 112: 391-400. Ref.: https://goo.gl/4xt37g
- Greenfield DS, Bagga H, Knighton RW. Macular thickness changes in glaucomatous optic neuropathy detected using optical coherence tomography. Arch Ophthalmol. 2003; 121: 41-46. Ref.: https://goo.gl/wRBvRH
- Tan O, Chopra V, Lu AT, Schuman JS, Ishikawa H, et al. Detection of Macular Ganglion Cell loss in glaucoma by Fourier-Domain Optical Coherence Tomography. Ophthalmology. 2009; 116: 2305-2314. Ref.: https://goo.gl/o5Khsf
- Takagi ST, Nose A, Kita Y, Tomita G. Inner Retinal Layer Measurements in Macular Region With Fourier Domain Optical Coherence Tomography in Glaucomatous Eyes With Hemifield Defects. Invest Ophthalmol Vis Sci. 2008; 49. Ref.: https://goo.gl/Dqqe8k
- Mori S, Hangai M, Nakanishi H, Kotera Y, Inoue R, et al. Macular Inner and Total Retinal Volume Measurement by Spectral Domain Optical Coherence Tomography for Glaucoma Diagnosis. Invest Ophthalmol Vis Sci. 2008; 49. Ref.: https://goo.gl/vcmw4H