
More Information
Submitted: February 15, 2022 | Approved: March 08, 2022 | Published: March 09, 2022
How to cite this article: Engin KN, Yiğit U, Bayramoğlu ST, Güner NT, Özyurt O, Tufan K, et al. Clinical evaluation of the eye-to-visual-pathway integrity of glaucomatous neuro-degeneration using 1.5T MR imaging: The integrity of glaucomatous neurodegeneration. Int J Clin Exp Ophthalmol. 2022; 6: 001-006.
DOI: 10.29328/journal.ijceo.1001042
Copyright Licence: © 2022 Engin KN, et al. This is an open access article distributed under the Creative Commons Attribution License, which permits unrestricted use, distribution, and reproduction in any medium, provided the original work is properly cited.

Clinical evaluation of the eye-to-visual-pathway integrity of glaucomatous neurodegeneration using 1.5T MR imaging: The integrity of glaucomatous neurodegeneration
Kaya N Engin1* , Ulviye Yiğit2#, Sibel Töreyen Bayramoğlu3#, Nurten Turan Güner3#, Onur Özyurt4#, Kutlay Tufan2#, Ahmet Ağaçhan2# and Penbe Çağatay5#
1Department of Ophthalmology, Ümraniye Education and Research Hospital, Sağlık University, Istanbul, Turkey
2Department of Ophthalmology, Bakırköy Education and Research Hospital, Istanbul, Turkey
2Department of Radiology, Bakırköy Education and Research Hospital, Istanbul, Turkey
4Institute of Biomedical Engineering, Bogazici University, Istanbul, Turkey
5Department of Biostatistics and Medical Informatics, Faculty of Medicine, Istanbul University, Istanbul, Turkey
#These authors contributed equally to this work.
*Address for Correspondence: Kaya N Engin, MD, PhD., Department of Ophthalmology, Ümraniye Education and Research Hospital, Sağlık University, Istanbul, Turkey, Email: [email protected]
Aim: Accumulating data imply that glaucoma may represent a neurodegenerative disorder affecting the entire visual system. We evaluated retrobulbar glaucomatous damage with favorable techniques for 1.5T diffusion-tensor magnetic resonance imaging and we compared those techniques with clinical data in a large case series.
Material and methods: This Cross-sectional study included 130 eyes of 65 patients with primary open-angle glaucoma. Patients with no known ocular or systemic concomitant disorders, neurological diseases, previous glaucoma surgeries, or antioxidant usage were selected. A decrease in thickness and deterioration in the optic nerve diffusion of severely glaucomatous eyes of patients with asymmetrical involvement was observed in optic nerve tractography. Optical coherence tomography and visual field results of the subjects were recorded. Glaucoma analysis with optical coherence tomography and standard automated perimetry results of the subjects were recorded. Diffusion-tensor magnetic resonance imaging analysis of optic nerves and radiations were performed, computing fractional anisotropy, apparent diffusion coefficient, axial diffusivity, and radial diffusivity. Correlation between the diffusion-tensor magnetic resonance imaging and clinical eye parameters of glaucomatous neurodegeneration were statistically evaluated.
Results: The correlations between diffusion parameters and age were highly significant. Statistically significant correlations were found between ganglion cell complex and apparent diffusion coefficient, axial and radial diffusivities of optic nerves.
Conclusion: Eye-brain connection in glaucoma can be evaluated with routine clinical instruments. Our study also revealed a limited correlation of retrobulbar glaucomatous neurodegeneration with ophthalmic damage. A better understanding of retrobulbar damage will enable us to develop more efficient strategies and a more accurate understanding of glaucoma.
Glaucoma represents a group of neurodegenerative diseases characterized by structural damage to the optic nerve and the slow, progressive death of retinal ganglion cells (RGCs). Although elevated intraocular pressure (IOP) is traditionally considered the most important risk factor for glaucoma, progressive visual field loss is still a prevalent evidence-based clinical knowledge in cases with well-controlled IOPs [1]. Gupta and Yücel have provided primary histopathological evidence, including degenerative, neurochemical, and metabolic changes similar to those seen in other neurodegenerative diseases, in the lateral geniculate nucleus (LGN) [2] and changes in activity in both the LGN and visual cortex [3], in glaucoma patients. Optic nerve and LGN shrinkage and cortical ribbon thickness reduction in the postmortem specimens of a glaucomatous patient have been reported by the same group [4].
In light of these findings, studies for in vivo demonstration of brain damage in patients with glaucoma vastly increased in numbers. For this purpose, the most commonly used technology is magnetic resonance (MR) imaging. Duncan, et al. have demonstrated the reflection of a glaucomatous visual field (VF) defect in the cerebral cortex with functional MR imaging [5] as a reminder of the fact that a defect in the VF may originate from pathology in any location ranging from the retina to the cortex [6]. In normotensive glaucoma, the depth of VF defect has been correlated with cerebral ischemia, suggesting that the disease may be influenced by factors outside the eye, at least in this subset of patients [7]. Diffusion-tensor magnetic resonance imaging (DTI) is a useful technique for imaging white matter tracts, including the posterior visual pathways. It is based on the principle of movement of water proton within white matter tracts. Such movement is known as anisotropic diffusion which depends on the structural environment of white matter. The largest eigenvalue is the axial diffusivity (λ1) and reflects axonal integrity, whereas λ2 and λ3 quantify radial diffusivity (λ┴), and reflect myelin integrity. These movements form anisotropy, which can be specifically defined as fractional anisotropy (FA) and apparent diffusion coefficient (ADC). Nerve fiber loss and disruption of organization result in increased levels of ADC and decreased levels of FA, respectively. A nerve can be traced with anisotropy maps, a process referred to as “Tractography” [8]. The visual pathway can be imaged from the optic nerve to the LGN, then from the LGN to the primary visual cortex with this method [9]. These techniques have been successfully used to demonstrate in vivo 6T-DTI in a rat model of glaucoma [10], as well as in humans with glaucoma using 3T MRI [11].
In current practice, we most frequently use optical coherence tomography (OCT) and standard automated perimetry (SAP), to structurally and functionally examine glaucomatous damage in the eye [12].
In our pilot studies [13], we developed techniques convenient for 1.5 T routine clinical MRI instruments which could be used to aid in both the diagnosis and follow-up of glaucoma. In this study, we compared those techniques with data from clinical OCT and SAP in a large case series.
This cross-sectional study included 130 eyes of 65 patients with primary open-angle glaucoma (POAG). Patients with no known ocular or systemic concomitant disorders, neurological diseases, previous glaucoma surgeries, or antioxidant usage were selected. The research adhered to the tenets of the Declaration of Helsinki. Approval from Bakırköy Education and Research Hospital, Ethics Committee, and informed consent from the subjects were obtained. All applicable institutional and governmental regulations concerning the ethical use of human volunteers were followed during the research. The patients underwent a detailed ophthalmic examination, including mean logarithm of the minimum angle of resolution- best-corrected visual acuity (LogMAR-BCVA) and IOP with Pascal Dynamic Contour tonometry (Nidek inc., Fremont, CA, USA) measurements. Patients whose IOPs were higher than 21 mm Hg despite medical treatment were excluded. Both anterior and posterior segment analyses with OCT were taken with RTVue-100 Fourier domain OCT (Nidek inc., Fremont, CA, USA). Along with central corneal thickness (CCT), cup-disc ratio (c/d), retinal nerve fiber layer thickness (RNFL), and ganglion cell complex (GCC) were recorded. 30-2 VF analysis via SAP was taken with the Humphrey Field Analyzer Model 740i (Carl Zeiss Inc. Dublin, CA, USA), and mean (MD) and pattern standard (PSD) deviations were obtained.
While glaucomatous grading was ignored in correlation analyses, five patients showing highly glaucomatous asymmetries were selected for the within-subjects comparison with fiber tractography. Glaucomatous asymmetries are defined according to the OCT and VF findings along with optic nerve head cupping ratios (c/d) and other clinical findings.
Color Doppler ultrasonography (Logiq S8 US, ML 6-15MHz D probe. General Electric Inc. Louisville, KY, USA) was performed in the carotid, ophthalmic, posterior ciliary, and central retinal arteries to eliminate ischemic pathology. DTI analysis of optic nerves and ipsilateral and contralateral optic radiations were performed with original semi-automatic techniques. Fractional anisotropy (FA), apparent diffusion coefficiency (ADC), axial (l1), and radial diffusivities (l┴) were measured. Correlations with SAP and OCT findings, age, sex, and visual acuity were statistically evaluated. All the measurements are completed on the same week for each subject.
MR imaging acquisition
Whole-brain T1-weighted axial 3D-MPRAGE MR images (TR = 1900 ms, TE = 3.53 ms, matrix = 256 x 256, 144 slices, voxel size = 1 x 1 x 1 mm) were acquired on a 1.5 Tesla equipment (Avanto Siemens Erlangen, Germany). Then, a single shot spin-echo echo-planar sequence (TR = 7100 ms, TE = 109 ms, matrix = 128 x 128, 45 slices to cover the whole brain, voxel size = 2 × 2 × 2 mm) was used for DTI with diffusion gradients in 30 different directions and with two different b values (b = 0, 1.000 s/mm2). The imaging duration was approximately eight minutes for each patient.
DTI data analysis
Diffusion-weighted images were first separated from non-brain sections using FSL software. Using MedINRIA software on those images, diffusion tensor maps and fiber tractography was created. Regions of interest (ROI)s in three planes were selected to include the optic nerve in its entirety. To ensure a fair comparison of the relatively subjective ROI-based quantitation procedures, care was also taken to include similar areas in each selection. Care was also taken to stay at the center in order to handle the partial volume effect from the potentially increased cerebrospinal fluid contents (Figure 1).
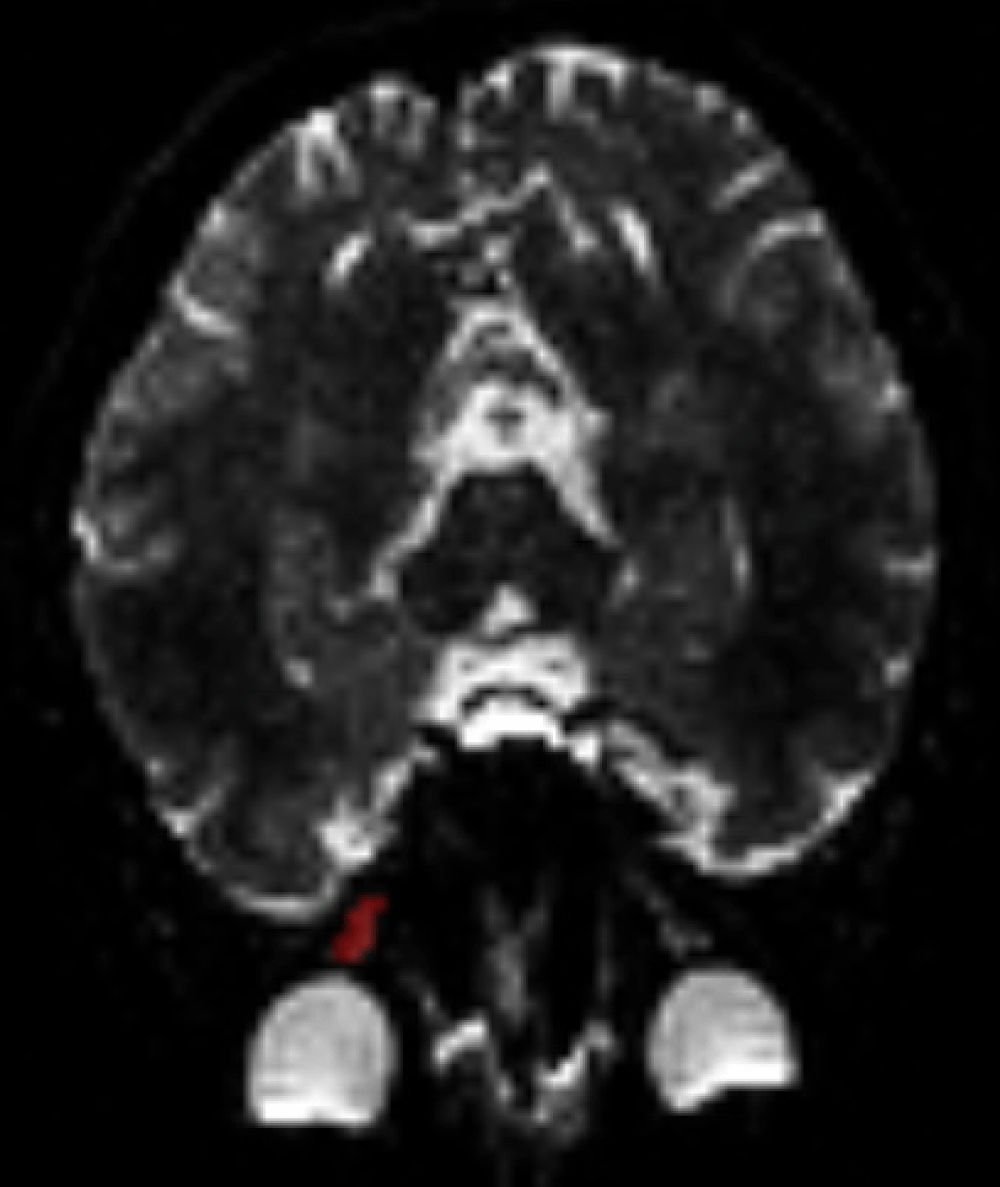
Figure 1: ROI (Region of Interest) determination. ROI determination from an optic nerve (in red) for diffusion analysis with DTI.
DTI parametric values FA, ADC, λ1, λ2, λ3 of the optic nerves were calculated [14]. Parameters were also calculated in optic radiation areas with a semiautomatic marking technique. DTI maps obtained from patients were overlapped with a standard DTI image described in MNI152 space by order of in linear (FLIRT) and nonlinear (FNIRT) fashions [15,16]. Each optic radiation was marked with the help of the Jülich Histological atlas [17] in the same standard space [18]. Those regions were selected -and retouched when necessary, by experienced radiologists (Figure 2).
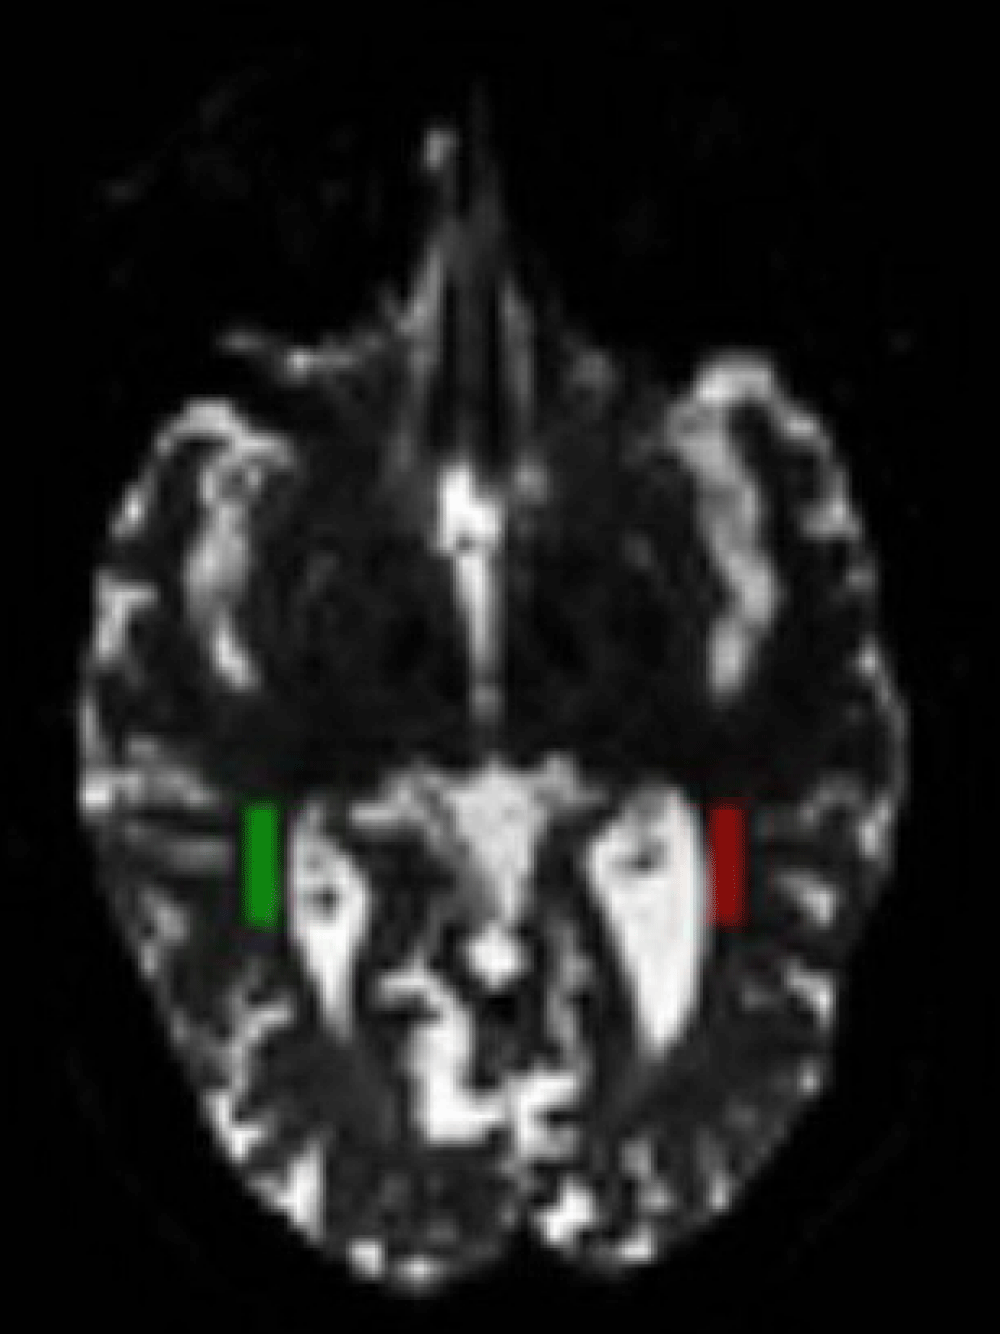
Figure 2: ROI (Region of Interest) determination. ROI determination from ipsilateral and contralateral optic radiations (in two colors) for diffusion analysis with DTI.
Statistical analysis
Statistical analyses were conducted using SPSS 17.0 software. The normality of data was evaluated by the Shapiro-Wilk test. Spearman’s correlation coefficient was determined where appropriate. p - values less than 0.05 were considered significant.
In examinations performed with a Color Doppler ultrasonography, no vascular anomaly was observed. Baseline demographic and ophthalmic information of the study participants were shown in Table 1.
| Table 1: Baseline demographic and ophthalmic information of the study participants. | ||||||||
| f/m | Age | Vision | CCT | MD | PSD | c/d | m-RNFL | GCC |
| 36/29 | 57.4 | 0.09 ± 0.04 |
551.4 ± 6.36 |
- 6.51 ± 3.18 |
5.09 ± 2.88 |
0.48 ± 0.11 |
96.16 ± 17.83 |
94.25 ± 9.72 |
| f/m: female/male ratio; CCT: Central Corneal Thickness; MD: Mean Deviation; PSD: Pattern Standard Deviation; c/d: Optic nerve head cupping ratios; m-RNFL: mean Retinal Nerve Fiber Layer Analysis; GCC: Ganglion Cell Complex. | ||||||||
For the within-subjects comparison with fiber tractography. In comparison with each patient’s fellow eye, a decrease in thickness and deterioration in the optic nerve diffusion of severely glaucomatous eyes of patients with asymmetrical involvement were observed in ON tractography (Figure 3) but no difference could be imaged in ORs (Figure 4).
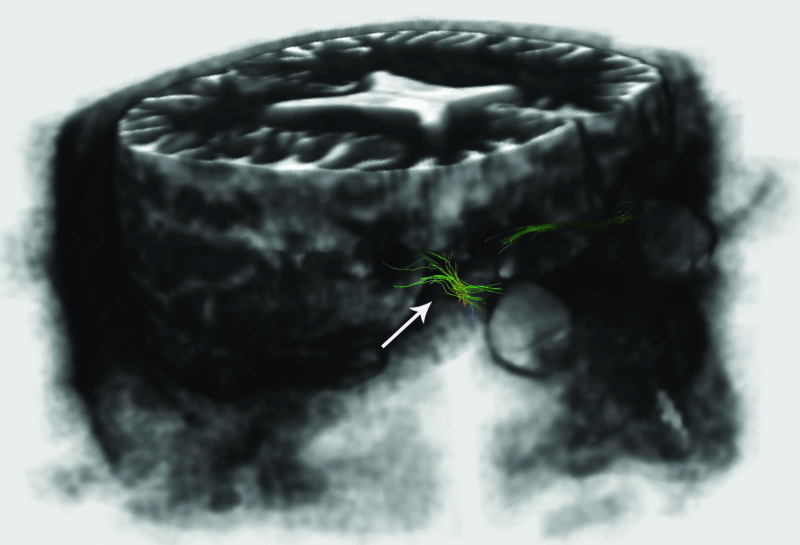
Figure 3: Imaging of glaucomatous neurodegeneration in optic nerves. Decrease in thickness and deterioration (arrows) in the optic nerve tractography in the severely affected eye.
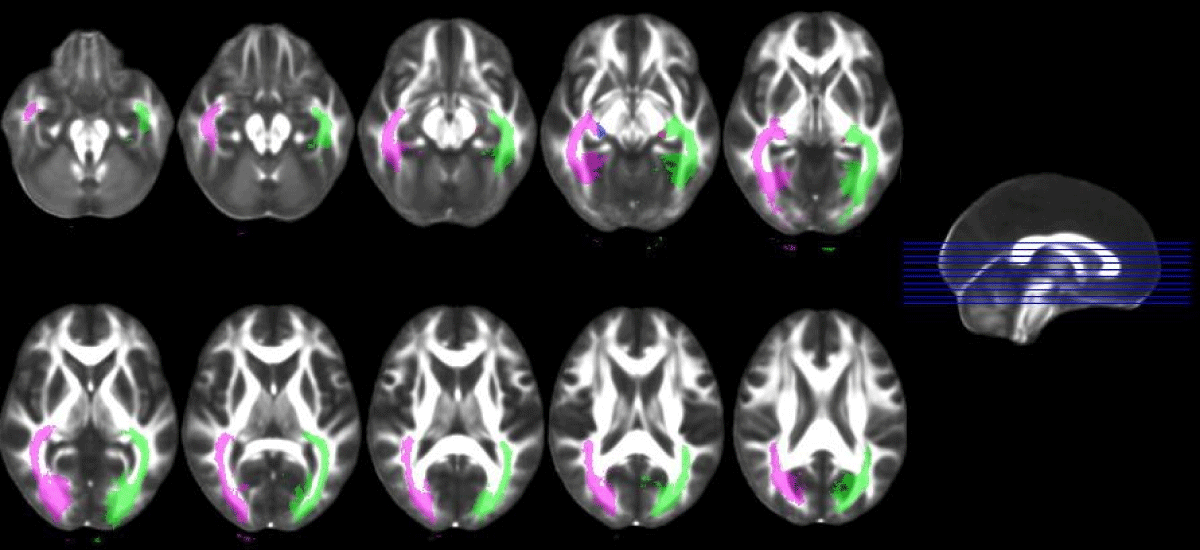
Figure 4: Imaging of optic radiations with tractography.
In DTI data analysis, age-related diffusion parameters of OR-I and OR-C were found to be identical. ADC and FA, λ┴ were found to be significantly correlated with age, while the former yielded a positive correlation and the latter yielded a negative one. FA and l1 values of ON were found to be negatively correlated with age. OR-I λ┴ and OR-C ADC, λ┴ values yielded significant negative correlations with logMAR-BCVA. On the other hand, ON values yielded no significant correlation (Table 2). The correlations between DTI and SAP findings were likewise not statistically significant (Table 3). Among the OCT findings, only statistically significant correlations were found between GCCs and ADC, l1, l┴ of optic nerves (Table 4).
| Table 2: Correlation of DT MR results with patient data and corneal thickness. | |||||
| Age-rs | p | Vision-rs | p | ||
| ON | FA | -,252* | ,012 | ,078 | ,443 |
| ADC | -,101 | ,319 | -,045 | ,656 | |
| λ1 | -,276** | ,006 | ,001 | ,993 | |
| λ┴ | ,013 | ,900 | -,083 | ,412 | |
| OR-I | FA | -,237* | ,016 | ,122 | ,218 |
| ADC | ,257** | ,009 | -,137 | ,168 | |
| λ1 | ,037 | ,707 | -,022 | ,828 | |
| λ┴ | ,365** | ,000 | -,237* | ,016 | |
| OR-C | FA | -,237* | ,016 | ,114 | ,250 |
| ADC | ,257** | ,009 | -,212* | ,031 | |
| λ1 | ,037 | ,707 | -,062 | ,537 | |
| λ┴ | ,365** | ,000 | -,248* | ,012 | |
| Grey areas and *represent statistically significant correlation and p values respectively. ON: Optic Nerve; OR-I: Ipsilateral Optic Radiation; OR-C: Contralateral Optic Radiation; FA: Fractional Anisotropy; ADC: Apparent Diffusion Coefficiency; λ1: Axial Diffusivity; λ┴: Radial Diffusivity; rs: Spearman's Correlation Coefficient | |||||
| Table 3: Correlation of DT MR results with CVF findings. | |||||
| MD-rs | p | PSD-rs | p | ||
| ON | FA | ,125 | ,249 | -,198 | ,071 |
| ADC | -,102 | ,349 | ,047 | ,865 | |
| λ1 | -,008 | ,941 | ,087 | ,430 | |
| λ4 | -,111 | ,307 | -,241 | ,652 | |
| OR-I | FA | ,005 | ,965 | ,032 | ,770 |
| ADC | -,115 | ,280 | -,314 | ,821 | |
| λ1 | -,126 | ,237 | ,027 | ,905 | |
| λ4 | -,103 | ,336 | -,053 | ,628 | |
| OR-C | FA | -,031 | ,774 | ,042 | ,697 |
| ADC | -,064 | ,547 | -,029 | ,792 | |
| λ1 | -,094 | ,380 | ,017 | ,875 | |
| MD: Mean Deviation; PSD: Pattern Standard Deviation; ON: Optic Nerve; OR-I: Ipsilateral Optic Radiation; OR-C: Contralateral Optic Radiation, FA: Fractional Anisotropy, ADC: Apparent Diffusion Coefficiency; λ1: Axial Diffusivity; λ┴: Radial Diffusivity; rs: Spearman's Correlation Coefficient. | |||||
| Table 4: Correlation of DT MR results with OCT findings. | |||||||||||
| c/d-rs | p | m-RNFL-rs | p | s-RNFL-rs | p | i-RNFL-rs | p | GCC-rs | p | ||
| ON | FA | -,111 | ,272 | ,102 | ,303 | ,082 | ,424 | ,072 | ,483 | ,173 | ,094 |
| ADC | ,063 | ,530 | -,101 | ,307 | -,141 | ,169 | -,107 | ,299 | -,326** | ,007 | |
| l1 | -,012 | ,908 | -,094 | ,338 | -,201* | ,048 | -,190 | ,063 | -,304** | ,003 | |
| l4 | ,119 | ,239 | -,100 | ,310 | -,178 | ,081 | -,120 | ,241 | -,305** | ,003 | |
| OR-I | FA | ,059 | ,549 | ,150 | ,121 | ,107 | ,286 | ,211* | ,035 | ,233* | ,023 |
| ADC | -,084 | ,397 | -,069 | ,476 | ,020 | ,840 | -,020 | ,843 | -,164 | ,132 | |
| l1 | -,068 | ,491 | ,093 | ,334 | ,143 | ,154 | ,137 | ,172 | -,071 | ,595 | |
| l4 | -,094 | ,340 | -,143 | ,139 | -,055 | ,583 | -,148 | ,140 | -,198 | ,108 | |
| OR-C | FA | -,014 | ,891 | ,107 | ,266 | ,097 | ,333 | ,144 | ,149 | ,192 | ,063 |
| ADC | -,107 | ,279 | -,126 | ,190 | -,104 | ,299 | -,067 | ,507 | -,141 | ,172 | |
| l1 | -,125 | ,207 | -,050 | ,603 | -,036 | ,724 | -,020 | ,846 | -,062 | ,550 | |
| l4 | -,126 | ,203 | -,125 | ,194 | -,083 | ,411 | -,101 | ,315 | -,177 | ,086 | |
| Grey areas and *represent statistically significant correlation and p values, respectively. c/d: Optic Nerve Head Cupping Ratios; m-RNFL: Mean Retinal Nerve Fiber Layer Analysis; s-RNFL: superior Retinal Nerve Fiber Layer Analysis; i-RNFL: Inferior Retinal Nerve Fiber Layer Analysis; GCC: Ganglion Cell Complex; ON: Optic Nerve; OR-I: Ipsilateral Optic Radiation; OR-C: Contralateral Optic Radiation; FA: Fractional Anisotropy; ADC: Apparent Diffusion Coefficiency; λ1: Axial Diffusivity; λ┴: Radial Diffusivity, rs: Spearman's Correlation Coefficient | |||||||||||
Studies focused on glaucoma–brain connection have shown us that neurodegenerative changes in the brain should be taken into consideration in the diagnosis and follow-up of glaucoma [19]. In this study, the retrobulbar glaucomatous neurodegeneration was not only imaged with 1.5T DTI but statistically significant data were obtained in the DTI analysis to evaluate the direct correlation between eye and central nervous system findings. Ophthalmic measurements were obtained with both OCT and SAP. MD and RNFL values were found to predict the retrobulbar neurodegeneration more accurately than other parameters. Axon portion of RNFL thickness is proportional to local field sensitivity loss [20], and the recently recognized view is that glaucomatous damage affects both structure and function in linear proportions [13,21].
The optic nerve is of specific importance since it contains the axons of the RGCs, the primary cell known to be affected in glaucomatous optic neuropathy and it provides information on the ipsilateral eye [22]. Although the structure and diameter of the optic nerve may have significant inter-individual variation (in the range of 4-9 mm) [23], many studies have revealed an association between DTI analysis of the optic nerves and clinical glaucoma findings. In a study conducted with conventional MRI in patients with glaucoma, it was reported that the diameter of the optic nerve was significantly lower than that of the controls [24]. In our pilot studies, a decrease in thickness and deterioration in the optic nerve diffusion of severely glaucomatous eyes could be observed in both b0 coronal plane images and tractography with DTI at 1.5T [13]. In a DTI study with 7T MRI, as much as a 10% decrease in axonal density of the glaucomatous optic nerve was detected in seven glaucomatous rats, which were also histopathologically confirmed [10]. Furthermore, measuring retrobulbar optic nerve diameter [25] and volume [26] using 3T MR were described as clinical biomarkers for axonal loss in glaucomatous optic atrophy. These parameters were not included in our study because of the difficulty of obtaining reliable measurements with 1.5T MR imaging.
According to diffusion analysis studies carried out with 3T MR, the optic nerve diffusion parameters mean diffusion (DTI-MD) and FA were found to be closely correlated with morphological features of the optic nerve head analyzed by HRT-III, RNFL measured by an OCT [26], and the glaucoma stage [11,27] in smaller series. Chang, et al. [28] have reported in [27] patients that mean, axial, and radial diffusivities increase and fractional anisotropy decreases as the rim area decreases and the glaucoma stage increases. Sidek, et al. [29] also performed 3T DTI on 90 subjects (30 normal, 30 with mild glaucoma, and 30 with severe glaucoma), and they studied the correlation of DTI analysis with RNFL and the stage of the disease. They revealed that FA and DTI-MD in the optic nerve decreased and optic radiation increased as the disease progressed. Based on the strong correlation between FA values in the optic nerve and RNFL, they concluded that these parameters could serve as indicators of disease severity. Finally, Li, et al. [30] performed a meta-analysis of existing DTI studies on patients with glaucoma, and they revealed a significant FA reduction in the ON and OR, as well as a significant DTI-MD increase in the tracts. Using 1.5T DTI, a pro-study published by our study group carried out on 1 healthy subject and 7 glaucoma patients revealed correlations of the ADC with MD, PSD, and RNFL in the distal optic nerve and FA with GCC in proximal optic nerves [31].
These 3T DTI studies are compatible with our study, with the exceptions of the lack of a statistically significant correlation with RNFL and the existence of statistically significant correlations with GCC in our study. Results of this study obtained from 65 glaucoma patients revealed a limited correlation of 1.5T DTI analysis of the optic nerves with clinical eye findings, thereby implying the integrity of glaucomatous neurodegeneration from the eye to the visual pathways. Significant FA reduction in the optic nerve and optic radiation with age is also consistent with the meta-analysis of Li, et al. [30] as they concluded that FA reduction may be correlated with glaucoma severity and age. GCC parameters are yet to be studied in the literature. Optic nerves consist of the axons of the retinal ganglion cells [3,22] and correlations with GCC are of importance.
Optic radiation does not provide information on the ipsilateral eye. In our study, age-related diffusion parameters of OR-I and OR-C were found to be identical for, age is a systemic parameter. Conversely, in another study including 50 glaucoma patients and 50 healthy age-matched controls, the ipsilateral eye was shown to be affected, most likely due to microangiopathic lesions [32]. Significant rarefaction of the optic radiation was reported in 44% of patients, and it was correlated with the glaucomatous optic nerve atrophy stage [12]. According to a recent article about the same study group [33], DTI analysis of optic radiation can be used for glaucoma detection with a discrimination accuracy of 94.1% and 100% for POAG and normal-tension glaucoma, respectively. In DTI studies, an increase in mean diffusivity values in addition to a decrease in FA values in both optic radiations and nerves [11], and a FA decrease along with an increase in l values [34] were reported in 16 and 30 patients, respectively.
Strategies independent from IOP, concerning the area beyond the optic nerve head, are needed in the evaluation and treatment of glaucoma [1,35]. Currently, it is possible to image visual pathways from the optic nerve to the cerebral cortex both structurally and functionally. As our study showed, clinical instruments that are largely in use are also adequate for clinical trials to reveal the glaucoma-brain connection; however, more sophisticated techniques are being developed to illuminate that relation further. A more comprehensive understanding of retrobulbar glaucomatous damage will enable us to determine more efficient diagnosis, follow-up and treatment strategies and facilitate answering important questions which remain unknown about this disease.
- Weinreb RN. Glaucoma neuroprotection: What is it? Why is it needed? Can J Ophthalmol. 2007; 42: 396-398. PubMed: https://pubmed.ncbi.nlm.nih.gov/17508033/
- Gupta N, Yücel YH. Glaucoma as a neurodegenerative disease. Curr Opin Ophthalmol. 2007; 18: 110-114. PubMed: https://pubmed.ncbi.nlm.nih.gov/17301611/
- Gupta N, Yücel YH. Brain changes in glaucoma. Eur J Ophthalmol. 2003; 13: 532-535. PubMed: https://pubmed.ncbi.nlm.nih.gov/12749675/
- Gupta N, Ang LC, de Tilly LN, Bidaisee L, Yucel YH. Human glaucoma and neural degeneration in intracranial optic nerve, LGN, and visual cortex. Br J Ophthalmol. 2006; 90: 674-678. PubMed: https://pubmed.ncbi.nlm.nih.gov/16464969/
- Duncan RO, Sample PA, Weinreb RN, Bowd C, Zangwill LM. Retinotopic organization of primary visual cortex in glaucoma: Comparing fMRI measurements of cortical function with visual field loss. Prog Retin Eye Res. 2007; 26: 38-56. PubMed: https://pubmed.ncbi.nlm.nih.gov/17126063/
- Landers J, Tang KC, Hing S. A visual field abnormality: Ocular or cerebral cause? Clin Experiment Ophthalmol. 2004; 32: 219-222. PubMed: https://pubmed.ncbi.nlm.nih.gov/15068443/
- Suziki J, Tamidokoro A, Araie M, Tomita G, Yamagami J, et al. Visual field damage in normal-tension glaucoma patients with or without ischemic changes in cerebral magnetic resonance imaging. Jpn J Ophthalmol. 2004; 48: 340-344.
- Nucifora PGP, Verma R, Lee S, Melhem ER. Diffusion-tensor MR imaging and tractography: Exploring brain microstructure and connectivity. Radiology 2007; 245: 367-384. PubMed: https://pubmed.ncbi.nlm.nih.gov/17940300/
- Sherenbondy AJ, Dougherty RF, Napel S, Wandell BA. Identifying the human optic radiation using diffusion imaging and fiber tractography. J Vis. 2008; 8: 1-11. PubMed: https://www.ncbi.nlm.nih.gov/pmc/articles/PMC2759943/
- Hui ES, Fu QL, So KF, Wu EX. Diffusion tensor MR study of optic nerve degeneration in glaucoma. Conf Proc IEEE Eng Med Biol Soc. 2007; 2007: 4312-4315. PubMed: https://pubmed.ncbi.nlm.nih.gov/18002956/
- Garaci FG, Bolachi F, Cerulli A, Melis M, Spano A, et al. Optic nerve and optic radiation neurodegeneration in patients with glaucoma: in vivo analysis with 3-T diffusion-tensor MR imaging. Radiology 2009; 252: 496-501. PubMed: https://pubmed.ncbi.nlm.nih.gov/19435941/
- Hood DC, Anderson SC, Wall M, Raza AS, Kardon RH. A test of a linear model of glaucomatous structure–function loss reveals sources of variability in retinal nerve fiber and visual field measurements. Invest Ophthalmol Vis Sci. 2009; 50: 4254-4266. PubMed: https://pubmed.ncbi.nlm.nih.gov/19443710/
- Engin KN. Functional and structural evaluation of retrobulbar glaucomateus damage. In: Kubena T, ed. The Mystery of Glaucoma, Rijeka, Croatia: In Tech Inc; 2011; 293-307.
- Smith SM, Jenkinson M, Woolrich MW, Beckmann CF, Behrens TE, et al. Advances in functional and structural MR image analysis and implementation as FSL. Neuroimage 2004; 23(Suppl): 208-219. PubMed: https://pubmed.ncbi.nlm.nih.gov/15501092/
- Woolrich MW, Jbabdi S, Patenaude B, Chappell M, Makni S, et al. Bayesian analysis of neuroimaging data in FSL. Neuroimage 2009; 45(1 Suppl): 173-186. PubMed: https://pubmed.ncbi.nlm.nih.gov/19059349/
- Eickhoff SB, Stephan KE, Molhberg H, Grefkes C, Fink GR, et al. A new SPM toolbox for combining probabilistic cytoarchitectonic maps and functional imaging data. Neuroimage. 2005; 25: 1325-1335. PubMed: https://pubmed.ncbi.nlm.nih.gov/15850749/
- Bürgel U, Amunts K, Hoemke L, Mohlberg H, Gilsbach JM, et al. White matter fiber tracts of the human brain: three-dimensional mapping at microscopic resolution, topography and intersubject variability. Neuroimage 2006; 29: 1092-1105. PubMed: https://pubmed.ncbi.nlm.nih.gov/16236527/
- Yücel YH, Zhang Q, Weinreb RN, Kaufman PL, Gupta N. Effects of retinal ganglion cell loss on magno-, parvo-, koniocellular pathways in the LGN and visual cortex in glaucoma. Prog Retin Eye Res. 2003; 22: 465-481. PubMed: https://pubmed.ncbi.nlm.nih.gov/12742392/
- Hood DC, Anderson SC, Wall M, Kardon RH. Structure versus function in glaucoma: an application of a linear model. Invest Ophthalmol Vis Sci. 2007; 48: 3662-3668. PubMed: https://pubmed.ncbi.nlm.nih.gov/17652736/
- Knight OJ, Chang RT, Feuer WJ, Kardon RH. Comparison of retinal nerve fiber layer measurements using time domain and spectral domain optical coherent tomography. Ophthalmology. 2009; 116: 1271-1277. PubMed: https://pubmed.ncbi.nlm.nih.gov/19395086/
- Sadun AA, Glaser JS, Bose S. Anatomy of the visual sensory system. In: Tasman W, Jaeger EA, eds. Duane's Ophthalmology. Philadelphia, PA, USA: Lippincott Williams & Wilkins. Chapter 34. 2007.
- Stark DD, Bradley WG. Magnetic Resonance Imaging. In: Scott W, ed. Orbit. Missouri, USA: Mosby; 1996; 988-1028.
- Kashiwagi K, Okubo T, Tsukahara S. Association of magnetic resonance imaging of anterior optic pathway with glaucomatous visual field damage and optic disc cupping. J Glaucoma 2004; 13: 189-195. PubMed: https://pubmed.ncbi.nlm.nih.gov/15118461/
- Lagreze WA, Gaggl M, Weigel M, Schulte-Mönting J, Bühler A, et al. Retrobulbar optic nerve diameter measured by high-speed magnetic resonance imaging as a biomarker for axonal loss in glaucomatous optic atrophy. Invest Ophthalmol Vis Sci. 2009; 50: 4223-4228. PubMed: https://pubmed.ncbi.nlm.nih.gov/19407026/
- Ramli NM, Sidek S, Rahman FA, Peyman M, Zahari M, et al. Novel use of 3T MRI in assessment of optic nerve volume in glaucoma. Graefes Arch Clin Exp Ophthalmol. 2014; 252: 995-1000. PubMed: https://pubmed.ncbi.nlm.nih.gov/24770532/
- Nucci C, Mancino R, Martucci A, Bolacchi F, Manetti G, et al. 3-T Diffusion tensor imaging of the optic nerve in subjects with glaucoma: correlation with GDx-VCC, HRT-III and Stratus optical coherence tomography findings. Br J Ophthalmol. 2012; 96: 976-980. PubMed: https://pubmed.ncbi.nlm.nih.gov/22628535/
- Omodaka K, Murata T, Sato S, Takhashi M, Tatewaki Y, et al. Correlation of Magnetic Resonance Imaging optic nerve parameters to Optical Coherence Tomography and the visual field in glaucoma. Clin Experiment Ophthalmol. 2014; 42: 360-368. PubMed: https://pubmed.ncbi.nlm.nih.gov/24119065/
- Chang ST, Xu J, Trinkaus K, Pekmezci M, Arthur SN, et al. Optic nerve diffusion tensor ımaging parameters and their correlation with optic disc topography and disease severity in adult glaucoma patients and controls. J Glaucoma 2013; 23: 513-520. PubMed: https://pubmed.ncbi.nlm.nih.gov/23632406/
- Sidek S, Ramli N, Rahmat K, Ramli NM, Abdulrahman F, et al. Glaucoma severity affects diffusion tensor imaging (DTI) parameters of the optic nerve and optic radiation. Eur J Radiol. 2014; 83: 1437-1441. PubMed: https://pubmed.ncbi.nlm.nih.gov/24908588/
- Li K, Lu C, Huang Y, Yuan L, Zeng D, et al. Alteration of fractional anisotropy and mean diffusivity in glaucoma: novel results of a meta-analysis of diffusion tensor imaging studies. PloS One. 2014; 9: e97445. PubMed: https://pubmed.ncbi.nlm.nih.gov/24828063/
- Engin KN, Yemişci B, Töreyen-Bayramoğlu S, Turan-Güner N, Özyurt O, et al. Structural and functional evaluation of glaucomatous neurodegeneration from eye to visual pathways using 1,5T MRI: A pilot study. J Clin Exp Ophthalmol. 2014; 5: 1000341.
- Murai H, Suzuki Y, Kiyosawa M, Tokumaru AM, Ishii K, et al. Positive correlation between the degree of visual field defect and optic radiation damage in glaucoma patients. Jpn J Ophthalmol. 2013; 57: 257-262.
- El-Rafei A, Engelhorn T, Wärntges S, Dörfler A, Hornegger J, et al. Glaucoma classification based on visual pathway analysis using diffusion tensor imaging. Magn Reson Imaging. 2013; 31: 1081-1091. PubMed: https://pubmed.ncbi.nlm.nih.gov/23751976/
- Zhang YQ, Li J, Xu L, Zhang L, Wang ZC, et al. Anterior visual pathway assessment by magnetic resonance imaging in normal-pressure glaucoma. Acta Ophthalmol. 2012; 90: e295-302. PubMed: https://pubmed.ncbi.nlm.nih.gov/22489916/
- Chidlow G, Wood JP, Casson RJ. Pharmacological neuroprotection for glaucoma. Drugs. 2007; 67: 725-759. PubMed: https://pubmed.ncbi.nlm.nih.gov/17385943/