
More Information
Submitted: April 24, 2025 | Approved: May 07, 2025 | Published: May 08, 2025
How to cite this article: Madhavi Gupta SV, Kaleel A. Comparison of Visual Field Progression in Patients with Primary Open Angle Glaucoma and Pseudo Exfoliative Glaucoma. Int J Clin Exp Ophthalmol. 2025; 9(1): 004-010. Available from:
https://dx.doi.org/10.29328/journal.ijceo.1001060.
DOI: 10.29328/journal.ijceo.1001060
Copyright Licence: © 2025 Madhavi Gupta SV, et al. This is an open access article distributed under the Creative Commons Attribution License, which permits unrestricted use, distribution, and reproduction in any medium, provided the original work is properly cited.
Keywords: Primary open angle glaucoma; Pseudo exfoliative glaucoma; Visual field progression; Visual field index; Mean deviation; Guided progression analysis; Humphrey field analyzer

Comparison of Visual Field Progression in Patients with Primary Open Angle Glaucoma and Pseudo Exfoliative Glaucoma
Madhavi Gupta SV1* and Asfa Khaleel1
1Professor, Department of Ophthalmology, JJM Medical College, Davangere, Karnataka, India
2Senior Resident, Department of Ophthalmology, JJM Medical College, Davangere, Karnataka, India
*Address for Correspondence: Dr. Madhavi Gupta SV, Professor, Department of Ophthalmology, JJM Medical College, Davangere, Karnataka, India, Email: [email protected]
Objective: Comparison of visual field progression in patients with Primary Open-angle Glaucoma (POAG) and Pseudo Exfoliative Glaucoma (PEXG).
Methods and materials: This is a 2-year longitudinal prospective study including 60 glaucomatous eyes with VA CF ≥ 3 m, IOP ≥ 20 mmHg, CDR ≥ 0.6 and those with Shaffer’s grade 3 or above were categorized as POAG along with signs of Pseudo exfoliative material as PEXG.
Patients on anti-glaucoma medications and those who have undergone cataract and glaucoma surgeries are also included in this study. 24-2 visual field test was performed using Humphrey Field Analyzer & the progression was assessed based on 3 parameters- Mean Deviation (MD), Visual Field Index (VFI) & Guided Progression Analysis (GPA).
Results: The difference in MD & VFI was higher in PEXG (-5.77 dB) (10.88%) than in POAG (-1.56 dB) (7.17%) respectively & was significant statistically (t - test, p = < 0.001). The GPA showed fast progression in 53.30% of cases in PEXG, 13.30% in POAG (Chi-square, p = < 0.001) about 63.30% of POAG & 46.70% of PEXG showed slow- moderate progression, but 23.30% of POAG subjects had no progression.
Conclusion: Compared to POAG, the study showed that PEXG had frequent & faster visual field worsening. Therefore, PEXG patients require more stringent management & treatment than those with POAG.
Glaucoma is a complex, genetically diverse disease characterized by the progressive apoptosis of retinal ganglion cells, leading to optic nerve damage and eventual visual field loss [1]. It ranks as the second leading cause of blindness globally [2,3], with an estimated 64.3 million cases among individuals aged 40-80 years in 2013, particularly concentrated in Asia [4].
The disease is primarily categorized into open angle and angle closure types, with Primary Open Angle Glaucoma (POAG) being the most prevalent subtype. POAG is marked by gradual, bilateral optic nerve fiber loss and characteristic optic disc cupping, often associated with elevated intraocular pressure (IOP) [1]. India accounts for approximately 18.9% of global open angle glaucoma cases [5], with a prevalence of 1.6% in southern India, where many remain undiagnosed [6].
In contrast, Pseudo Exfoliative Glaucoma (PEXG) is a secondary form that results from the accumulation of exfoliative material in the trabecular meshwork [3]. Although it shares similarities with POAG, PEXG is more aggressive, less responsive to medical treatments, and poses a higher risk of surgical complications [3]. Its management often necessitates more frequent follow-ups and earlier surgical intervention due to its unpredictable progression.
The progression of glaucoma is typically assessed through visual field deterioration, with guidelines recommending regular visual field testing to monitor changes. Key parameters for evaluating progression include the Visual Field Index (VFI), Mean Deviation (MD), and Guided Progression Analysis (GPA). Understanding the differences in visual field progression between POAG and PEXG is crucial for optimizing management strategies.
In the present prospective longitudinal study, we evaluated 60 eyes of which 30 eyes were diagnosed as POAG and 30 eyes as PEXG and were assessed for visual field progression analysis using Humphreys 24-2 visual field analyzer for a period of 2 years. The study was conducted at department of ophthalmology at JJM medical college, Davangere, Karnataka, India between June 2022 and July 2024.
Inclusion criteria include
- Patients with visual acuity of CF ≥ 3 m
- Intraocular pressure by Goldmann Applanation Tonometry ≥ 20 mm Hg.
- Shaffer Grading of 3 or more for at least 180° in both eyes by gonioscopy.
- Vertical Cup-disc Ratio (VCDR) ≥ 0.6 in either eye or VCDR asymmetry of ≥ 0.2
- Patients with signs of PEX either unilateral and/or bilateral presentation in all patients presenting in OPD during the period.
- Patients already on antiglaucoma drugs.
- Patients who required glaucoma surgery during follow-up period and uneventful cataract surgery.
- Frequency doubling technology perimetry (FDP) results suggestive of glaucomatous damage
Exclusion criteria include
- Patients with visual acuity less than CF 2 m
- Wrong diagnosis or insufficient information.
- Patients with prior history of any ocular surgery except cataract and glaucoma surgery or, uveitis, keratopathy, complicated cataract, trauma to eye, mental disorders.
- Patients with any intraocular tumours and true exfoliation syndrome
- Patients that cannot perform reliable visual fields at the beginning. Reliable visual fields were defined as: false positives ≤ 20% and/or false negatives ≤ 20% and/or fixation losses ≤ 30%.
- Patients suffering from another eye disease that could alter visual fields under study period like central vein occlusion, retinal detachment, etc.
- Patient not willing to be a part of study.
Method of collection of data
All the patients who satisfied the inclusion and exclusion criteria were taken for the study and the demographic data with detailed history was noted.
After obtaining written informed consent, all the patients underwent a detailed ophthalmic examination which included -- Best corrected visual acuity for distance using Snellen’s chart and near vision using Jaeger chart.
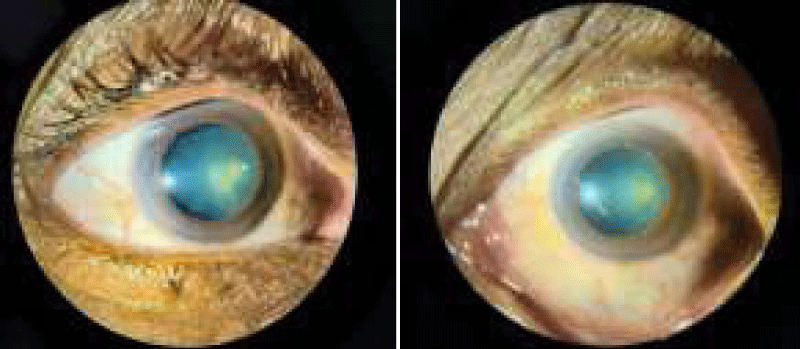
- Detailed slit lamp examination of anterior segment to identify grey white fibro granular material accumulated on lens capsule.
- IOP was measured using Goldmann Applanation tonometry.
- Gonioscopy to assess the trabecular meshwork and to check the presence of brown pigment along or in front of the Schwalbe’s line called the Sampaolesi’s line at the inferior angle.
- Pupillary dilation was achieved using Tropicamide (0.8% w/v) and Phenylephrine Hydrochloride (5% w/v) eye drops and to measure pupillary dilatation.
- Slit lamp fundus bio microscopy examination of the optic disc with a +90D lens through dilated pupil and the average of vertical cupping was recorded as the cup to disc ratio and optic nerve assessment.
- Visual field analysis with Humphrey field analysis 24-2.
Following complete clinical evaluation, patients were categorized into 2 groups
Group A - Those who were diagnosed as primary open angle glaucoma
Group B - Those who were diagnosed as pseudo exfoliative glaucoma.
Patients were followed up 6 monthly for a period of 2 years to follow up with the vision, IOP, and visual fields 24-2 using Humphreys’ field analysis.
The visual field progression was assessed based on the following 3 parameters-
- Visual field index (VFI)
- Mean deviation (MD)
- Guided progression analysis (GPA)
To classify the defects of the glaucomatous field, Hodapp – parrish- Anderson criteria was used in our study where the Mean deviation criteria is used for grading the severity of the glaucomatous field.
Statistical analysis
- The minimum required sample size to study the difference in the clinical presentation between the study groups was 30 eyes in each group.
- Hence a total sample size of 60 eyes (30 eyes in POAG and 30 eyes in PEX glaucoma) were selected for this study.
Data is analyzed with IBM SPSS version 22 for windows. Categorical data was represented in the form of frequency and percentage.
- Association between variable was assessed with Chi-Square test.
- Quantitative data was represented as Means and Standard Deviation (SD).
- Intergroup comparison was done with unpaired t test.
- Follow up assessment within the group was done with paired t test.
The sample size formula is-
Sample size
Where,
- Zᵦ - Std normal variate for power 80% power = 0.84
- Zα - 1.96
- d = mean difference between two groups
- Sd = Standard deviation
A total of 35 glaucoma patients were enrolled, with 15 patients having primary open-angle glaucoma (POAG) and 20 with pseudo exfoliation glaucoma (PEXG). The patients were divided into two groups: Group A (POAG, 15 patients, 30 eyes) and Group B (PEXG, 20 patients, 30 eyes). The mean age was 61.43 years with no significant difference between groups (p=0.921). Gender distribution also showed no significant difference (p = 0.207). Eye involvement was evenly distributed, with no significant difference between groups (p = 0.934) Group B exhibited significantly higher intraocular pressure (IOP) than Group A at all follow-up visits (p < 0.001). Cup-disc ratio (CDR) as seen in Table 1.
| Table 1: Baselinedemographic & clinical characteristics of patients included in the study(n = 35). | ||||
| Group A (POAG) | Group B (PEXG) | Test | p - value | |
| Age (years) (SD) | 61.67(11.22) | 61.25(12.84) | t - test | p = 0.921 |
| Gender (M/F) (%) | (12/3)(80% /20%) | (12/8)(60%/40%) | Fischertest | p = 0.207 |
| Laterality (R/L) (%) | (15/15)(50%/ 50%) | (16/14)(53.3%/46.7%) | Chisquare test | p = 0.934 |
| IOP mmHg (SD) | 29.50(3.11) | 46.60(3.97) | t - test | p <0.001 |
| CDR (SD) | 0.69(0.08) | 0.75(0.05) | t - test | p = 0.002 |
The Mean value of visual acuity was significantly better in group B (PEXG) as compared to group (POAG) in all four follow-ups visit with p – value < 0.001 as shown in Figure 1, Table 2.
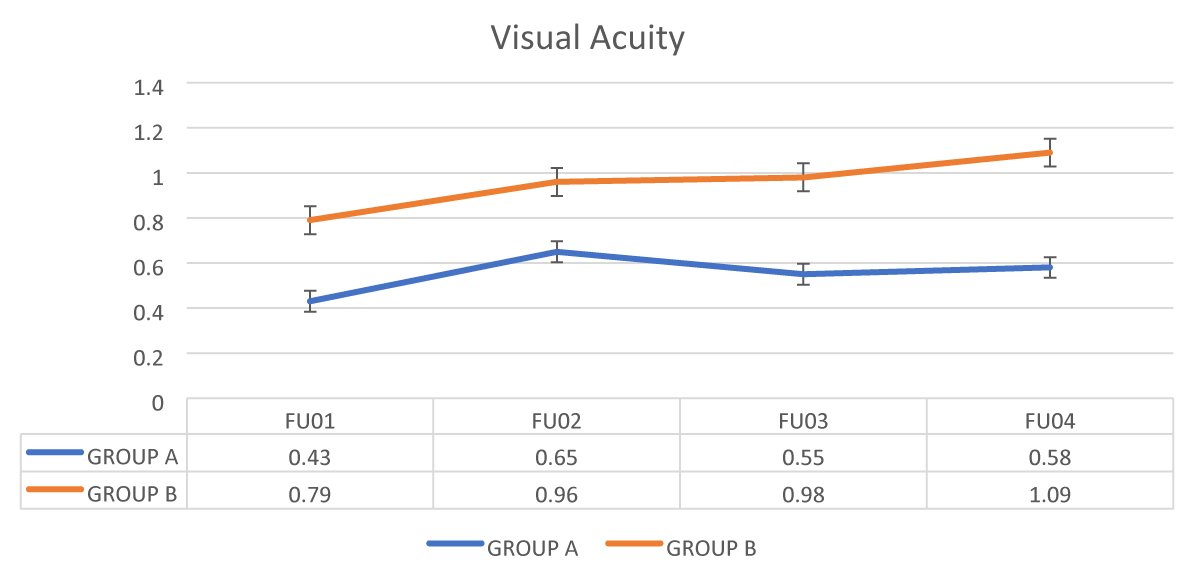
Figure 1: Comparison of Visual acuity between the 2 groups during their follow up period.
| Table 2: Comparison of Visual field progression between the 2 groups. | ||||||
| Follow UP Visits | Parameters | Group A | Group B | P - value (t - test) |
||
| Mean | Standard Deviation |
Mean | Standard Deviation |
|||
| Follow up - 01 | VFI | 80.00 | 23.21 | 48.17 | 32.45 | < 0.001 |
| MD | -7.29 | 7.00 | -18.32 | 10.19 | < 0.001 | |
| PSD | 5.64 | 3.82 | 6.16 | 2.85 | 0.55 | |
| Follow up - 02 | VFI | 78.07 | 22.91 | 39.17 | 30.13 | < 0.001 |
| MD | -8.13 | 6.85 | -20.75 | 8.94 | < 0.001 | |
| PSD | 6.13 | 3.84 | 6.97 | 2.83 | 0.34 | |
| Follow up - 03 | VFI | 75.73 | 22.81 | 30.47 | 24.86 | < 0.001 |
| MD | -8.37 | 7.01 | -22.66 | 7.99 | < 0.001 | |
| PSD | 6.52 | 3.66 | 8.16 | 3.05 | 0.07 | |
| Follow up - 04 | VFI | 72.83 | 22.90 | 20.73 | 21.57 | < 0.001 |
| MD | -8.85 | 7.03 | -24.09 | 11.75 | < 0.001 | |
| PSD | 7.31 | 3.60 | 8.75 | 3.61 | 0.13 | |
| VFI: Visual Field Index; MD: Mean Deviation; PSD: Pattern Standard Deviation | ||||||
The mean value of VFI was significantly lower in group B (PEXG) compared to group A (POAG) in all four follow-up visits with p – value < 0.001 as shown in Figure 2.
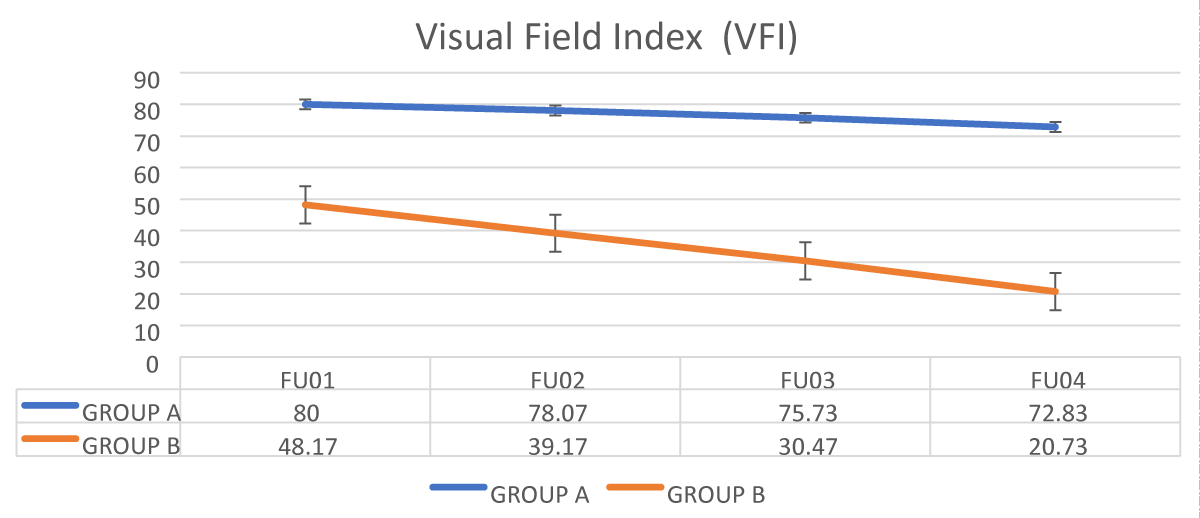
Figure 2: Comparison of Visual field index between the 2 groups.
The mean value of MD was significantly lower in group B (PEXG) as compared to group A (POAG) in all four follow up visit with p – value < 0.001 as shown in Figure 2.
In Group A- 46.7% eyes had early defect; 33.3%eyes had moderate defect and 20% eyes had severe defect. In Group B- 3.3% eyes had early defect; 10% eyes had moderate defect; and 86.7% eyes had severe defect as seen in Figure 3.
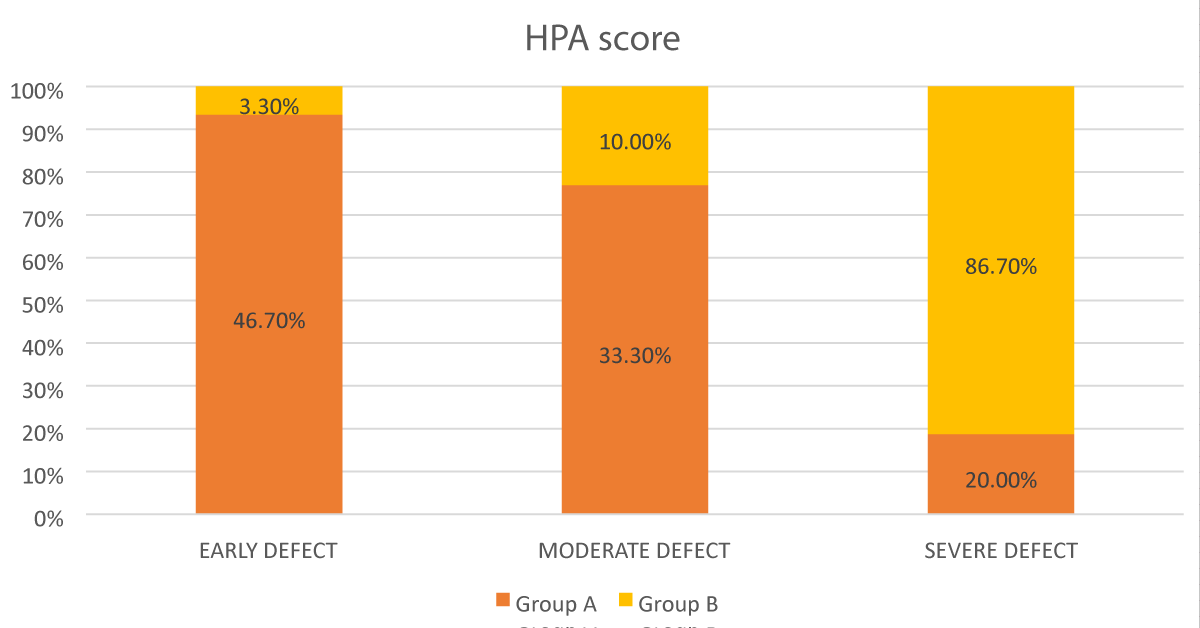
Figure 3: Bar diagram showing the comparison according to HPA score between the groups.
It was found that the severity according to HPA score was significantly higher in group B as compared to group A with p value < 0.001.
In Group A- 13.3% eyes had fast progression; 33.3% eyes had moderate progression; 30 % eyes had slow progression, and 7% eyes had no progression. In Group B- 53.3% eyes had fast progression; 36.70% eyes had moderate progression; and 10 % eyes had slow progression as seen in Figure 4.
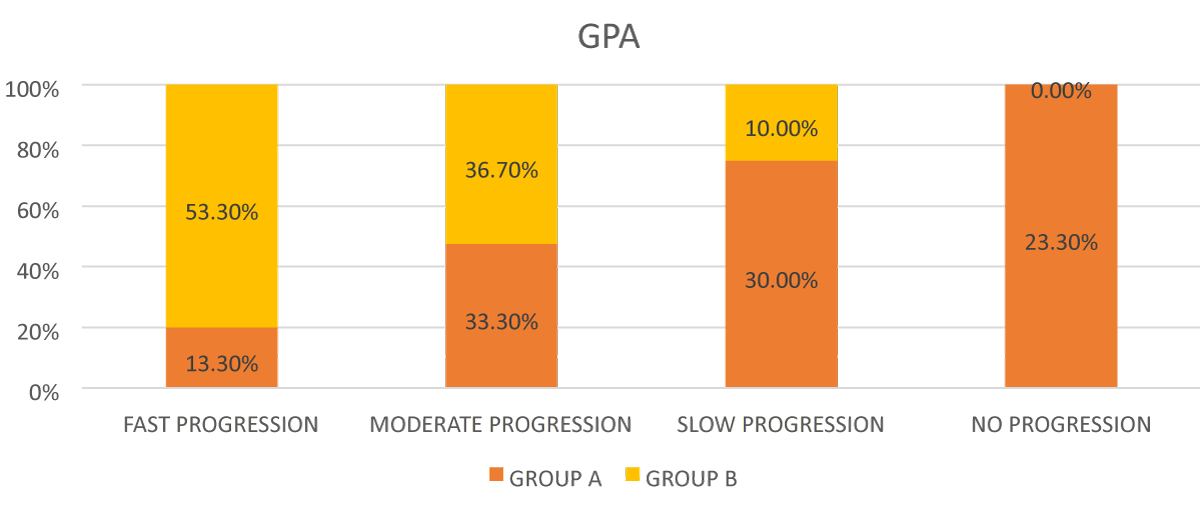
Figure 4: Bar diagram showing comparison of progression according to GPA between the 2 groups.
It was found that the speed of progression according to GPA was significantly higher in group B as compared to group A with p value = 0.001.
Glaucoma is a chronic, progressive optic neuropathy affecting the optic nerve complex, including the optic nerve head, Retinal Nerve Fiber Layer (RNFL), and peripapillary region, leading to corresponding damage in the Visual Field (VF). The term “glaucoma” originates from a Greek word meaning “clouded,” which may have historically referred to cataracts or corneal edema due to prolonged elevated pressure. Today, glaucoma is understood as a collection of conditions that share similar characteristics, such as cupping and atrophy of the optic nerve head, often leading to visual field loss and frequently associated with elevated intraocular pressure (IOP).
Primary Open-angle Glaucoma (POAG) is a multifactorial optic neuropathy defined by a characteristic acquired atrophy of the optic nerve, accompanied by loss of retinal ganglion cells and their axons. This occurs with open anterior chamber angles and results in specific visual field defects [7]. Primary glaucoma, such as POAG, are generally bilateral and are often linked to genetic predispositions. While various risk factors contribute to the development of POAG, elevated IOP remains the most significant.
IOP is regulated by the balance between the production of aqueous humor by the ciliary body, the resistance to its outflow at the anterior chamber angle, and episcleral venous pressure. Elevated IOP typically results from increased outflow resistance. Glaucoma-induced changes in the optic nerve and visual field depend on the susceptibility of optic nerve axons to damage. POAG is a chronic, progressive optic neuropathy that manifests with open angles, optic disc cupping, visual field loss, and optic atrophy in the absence of any identifiable ocular or systemic causes.
POAG progresses slowly and is typically asymptomatic until advanced stages. Most cases are identified through screening or routine eye exams. Although elevated IOP is not responsible for all POAG-related damage, it remains the primary risk factor. Corneal thickness is also a critical factor, influencing both IOP measurement accuracy and the risk of developing open-angle glaucoma [8]. The exact mechanism by which elevated IOP damages the optic nerve is unclear, but factors like ischemia, mechanical compression, local toxicity, or a combination of these may contribute.
Pseudo Exfoliative Glaucoma (PEXG) is a secondary form of open-angle glaucoma caused by the accumulation of exfoliative material in the trabecular meshwork. It mimics POAG in many ways and can often be overlooked. PEXG typically presents with optic nerve cupping, elevated IOP, and visual field loss in one eye, while the other eye shows no glaucoma signs. It tends to be more difficult to manage due to frequent IOP spikes, requiring regular follow-ups and often necessitating early surgical intervention due to medical therapy failure.
Both POAG and PEXG result in visual field defects, with their progression evaluated using the Hodapp-Parrish-Anderson (HPA) criteria, particularly focusing on the mean deviation to grade severity.
Age and gender distribution
The present study found no significant difference in the mean age between the POAG (61.67 years) and PEXG (61.25 years) groups (p = 0.921), which aligns with Ayala et al. study [9] where POAG and PEXG ages were 69.6 and 71.4 years respectively (p = 0.20). Similarly, there was no significant gender disparity between POAG (12M/3F) and PEXG (12M/8F), corroborating Ayala, et al.’s study (M:F ratio for POAG 28:26; PEXG 45:55, p = 0.57). Tarkkanen, et al. [10] reported comparable gender distributions, with 66% and 68% females in POAG and PEXG, respectively, while Tolga et al. indicated lower percentages of females (POAG 26%, PEXG 29%).
The lack of consensus on gender predilection for POAG mirrors broader literature inconsistencies. For example, the Baltimore Eye Survey [11] and Beaver Dam Eye Study [12] reported no gender difference in POAG prevalence, whereas studies like Framingham and Rotterdam indicated higher rates in males, and Blue Mountains Eye Study found higher rates in females [13,14].
Laterality
In this study PEXG was more likely to involve unilateral cases, with 10 patients presenting unilateral PEXG and 10 with bilateral involvement. This is consistent with Ayala, et al. [9] study that 78% of PEXG patients were unilateral, compared to 31% in the POAG group. Other studies, like studies by Astrom S, et al. and Musch, et al. [15,16] support this trend in unilaterality among PEXG patients.
Ayala et al. attributed the minimal chance of overlooking pseudo exfoliation to thorough dilated pupil examinations, noting that IOP in PEXG-affected eyes often exhibited disparities as large as 20–30 mmHg. Puska, et al. [17] reported a 38% conversion rate from unilateral to bilateral PEXG over a 10-year period, speculating that both eyes might harbor the disease, though its phenotypic expression may be asymmetric [18].
Visual acuity
In this study, Group B (PEXG) demonstrated significantly better visual acuity outcomes across all follow-ups (p < 0.001), culminating in a mean visual acuity of 1.09 in Follow-up 4, compared to 0.58 in Group A (POAG). The study by Ayala, et al. [9] showed visual acuity higher in the treatment group (mean 0.91) than the comparison group (0.84, p = 0.027).
Intraocular pressure
Baseline IOP was significantly higher in PEXG (46.60 mmHg) than POAG (29.50 mmHg). Ahrlich, et al. [19] and Kocaturk, et al. [20] reported similar trends, with PEXG patients showing higher IOp values and pachymetry readings compared to POAG.
Visual field progression
This study revealed that PEXG patients had a more rapid and severe decline in visual fields than POAG, with PEXG showing faster progression according to VFI, MD, and GPA scores. This finding aligns with Leske MC, et al. [21] Heijl A, et al. [22] and Kim, et al. [23] studies, which also found accelerated visual field progression in PEXG. For example, Ayala et al. reported a more significant MD difference in PEXG (-3.17 dB) compared to POAG (-1.25 dB) over three years. Moraes, et al. [24] also highlighted pseudo exfoliation as a risk factor for faster visual field loss, with a rate of -0.65 dB/year for MD values.
Guided progression analysis
The Guided Progression Analysis (GPA) is a pointwise event analysis program based on the pattern deviation (PD) data from the Swedish Interactive Thresholding Algorithm (SITA) tests or Full-Threshold tests and is based on the Early Manifest Glaucoma Trial progression criteria [25]. To establish a baseline, the procedure averages the patient’s first 2 reliable visual fields. The GPA compares each consecutive test to this baseline, point by point, to find any points that deviate beyond the 95% confidence interval for expected test-retest variability obtained from a group of stable glaucoma patients [26].
If 3 or more locations are confirmed in 2 consecutive tests, the GPA outcome is “possible progression” and if 3 or more are persistent in 3 consecutive tests, the GPA outcome is “likely progression”.
The diagnosis of progression using the GPA was found to closely correlate with clinical assessments. Arnalich-Montiel and coworkers reported that the “possible progression” criterion achieved a sensitivity and specificity of 93% and 95% respectively, and a positive likelihood ratio based on a thorough objective clinical assessment [27].
The GPA is clinically useful because it presents both the statistical significance of the changes compared with baseline tests, as well as whether these changes are confirmed and persistent on subsequent tests. This allows clinicians to distinguish true pathologic changes from test-retest variability.
The eyes in which more than three test locations showed progression. We could further classify these eyes into:
- Fast progressors (MD ≥ 2 dB/year)
- Moderate progressors (MD -1 to -2dB/year)
- Slow progressors (MD -0.5 to - 1dB/year)
In our study, 76.6 % eyes in POAG group showed progression out of which 30.00% showed slow progression, 33.30% showed moderate progression and 13.30% showed fast progression and 100% eyes of PEXG group showed progression out of which 10% showed slow progression, 36.70% showed moderate progression, and 53.30% showed fast progression. Though progress shows a large variability among individuals which helped to determine the rate of progression in each individual to choose the best treatment modality.
- Compared to individuals with primary open-angle glaucoma, those with pseudo exfoliation exhibited more rapid and frequent visual field progression, as determined by three separate methods of testing Visual Field Index (VFI), Mean Deviation (MD) and Guided Progression Analysis (GPA).
- In order to prevent further loss of vision, people with pseudo exfoliation glaucoma must be treated and managed more stringently than those with primary open-angle glaucoma.
- Given the increasing average life expectancy, long-term follow-up and treatment plans become more important in progressive and chronic diseases like glaucoma.
- Progression rates may vary among patients even within the same diagnostic or clinical subgroups.
- We recommend that long-term glaucoma progression be closely monitored, with treatment individualized based on visual field progression.
This study has several limitations such as it was a short follow up study. This study did not include data about anatomical progress using optical coherence tomography (OCT). One of the most significant limitations of the study is the exclusion of very advanced glaucoma subjects. Patients were excluded to avoid “ceiling effects.” Unfortunately, there is still no suitable method to evaluate glaucoma progression in advanced cases.
- Quigley HA. Number of people with glaucoma worldwide. Br J Ophthalmol. 1996;80(5):389-93. Available from: https://doi.org/10.1136/bjo.80.5.389
- Shaffer RN, Becker B. Diagnosis and therapy of the glaucomas. 8th ed. San Francisco: Elsevier; 1961.
- Quigley HA, Broman AT. The number of people with glaucoma worldwide in 2010 and 2020. Br J Ophthalmol. 2006;90(3):262-7. Available from: https://doi.org/10.1136/bjo.2005.081224
- Tham YC, Li X, Wong TY, Quigley HA, Aung T, Cheng CY. Global prevalence of glaucoma and projections of glaucoma burden through 2040: a systematic review and meta-analysis. Ophthalmology. 2014;121(11):2081-90. Available from: https://doi.org/10.1016/j.ophtha.2014.05.013
- Shields MB, Ritch R, Krupin T. Classification of the glaucomas. St. Louis: Mosby; 1996.
- Vijaya L, George R, Paul PG, Baskaran M, Arvind H, Raju P, et al. Prevalence of open-angle glaucoma in a rural south Indian population. Invest Ophthalmol Vis Sci. 2005;46(12):4461-7. Available from: https://doi.org/10.1167/iovs.04-1529
- American Academy of Ophthalmology. Primary open-angle glaucoma: Preferred practice pattern. San Francisco: The Academy; 2005.
- Brandt JD. Corneal thickness in glaucoma screening, diagnosis, and management. Curr Opin Ophthalmol. 2004;15(2):85-9. Available from: https://doi.org/10.1097/00055735-200404000-00004
- Ayala M. Comparison of visual field progression in newly diagnosed primary open-angle and exfoliation glaucoma patients in Sweden. BMC Ophthalmol [Internet]. 2020;20(1):322. Available from: https://doi.org/10.1186/s12886-020-01592-w
- Tarkkanen AHA, Kivelä TT. Comparison of primary open-angle glaucoma and exfoliation glaucoma at diagnosis. Eur J Ophthalmol. 2015;25(2):137-9. Available from: https://doi.org/10.5301/ejo.5000516
- Tielsch JM, Sommer A, Katz J, Royall RM, Quigley HA, Javitt J. Racial variations in the prevalence of primary open-angle glaucoma. The Baltimore Eye Survey. JAMA. 1991;266(3):369-74. Available from: https://pubmed.ncbi.nlm.nih.gov/2056646/
- Klein BE, Klein R, Sponsel WE, Franke T, Cantor LB, Martone J, et al. Prevalence of glaucoma. The Beaver Dam Eye Study. Ophthalmology. 1992;99(10):1499-504. Available from: https://doi.org/10.1016/s0161-6420(92)31774-9
- Leibowitz HM, Krueger DE, Maunder LR, Milton RC, Kini MM, Kahn HA, et al. The Framingham Eye Study monograph: An ophthalmological and epidemiological study of cataract, glaucoma, diabetic retinopathy, macular degeneration, and visual acuity in a general population of 2631 adults, 1973–1975. Surv Ophthalmol. 1980;24(Suppl):335-610. Available from: https://pubmed.ncbi.nlm.nih.gov/7444756/
- Mitchell P, Smith W, Attebo K, Healey PR. Prevalence of open-angle glaucoma in Australia. The Blue Mountains Eye Study. Ophthalmology. 1996;103(10):1661-9. Available from: https://doi.org/10.1016/s0161-6420(96)30449-1
- Åström S, Stenlund H, Lindén C. Incidence and prevalence of pseudoexfoliations and open-angle glaucoma in northern Sweden: II. Results after 21 years of follow-up. Acta Ophthalmol Scand. 2007;85(8):832-7. Available from: https://doi.org/10.1111/j.1600-0420.2007.00980.x
- Musch DC, Shimizu T, Niziol LM, Gillespie BW, Cashwell LF, Lichter PR. Clinical characteristics of newly diagnosed primary, pigmentary, and pseudoexfoliative open-angle glaucoma in the Collaborative Initial Glaucoma Treatment Study. Br J Ophthalmol. 2012;96(9):1180-4. Available from: https://doi.org/10.1136/bjophthalmol-2012-301820
- Puska PM. Unilateral exfoliation syndrome: conversion to bilateral exfoliation and to glaucoma: a prospective 10-year follow-up study. J Glaucoma. 2002;11(6):517-24. Available from: https://doi.org/10.1097/00061198-200212000-00012
- Hammer T, Schlotzer-Schrehardt U, Naumann GO. Unilateral or asymmetric pseudoexfoliation syndrome? An ultrastructural study. Arch Ophthalmol. 2001;119(7):1023-31. Available from: https://doi.org/10.1001/archopht.119.7.1023
- Ahrlich KG, De Moraes CG, Teng CC, Prata TS, Tello C, Ritch R, et al. Visual field progression differences between normal-tension and exfoliative high-tension glaucoma. Invest Ophthalmol Vis Sci. 2010;51(3):1458-63. Available from: https://doi.org/10.1167/iovs.09-3806
- Kocaturk T, Bekmez S, Katranci M, Cakmak H, Dayanir V. Long term results of visual field progression analysis in open angle glaucoma patients under treatment. Open Ophthalmol J. 2015;9:116-20. Available from: https://doi.org/10.2174/1874364101509010116
- Leske MC, Heijl A, Hyman L, Bengtsson B, Dong L, Yang Z; EMGT Group. Predictors of long-term progression in the Early Manifest Glaucoma Trial. Ophthalmology. 2007;114(11):1965-72. Available from: https://doi.org/10.1016/j.ophtha.2007.03.016
- Heijl A, Bengtsson B, Hyman L, Leske MC. Natural history of open-angle glaucoma. Ophthalmology. 2009;116(12):2271-6. Available from: https://doi.org/10.1016/j.ophtha.2009.06.042
- Kim JH, Rabiolo A, Morales E, Yu F, Afifi AA, Nouri-Mahdavi K, et al. Risk factors for fast visual field progression in glaucoma. Am J Ophthalmol. 2019;207:268-78. Available from: https://doi.org/10.1016/j.ajo.2019.06.019
- De Moraes CG, Prata TS, Tello C, Ritch R, Liebmann JM. Glaucoma with early visual field loss affecting both hemifields and the risk of disease progression. Arch Ophthalmol. 2009;127(9):1129-34. Available from: https://doi.org/10.1001/archophthalmol.2009.165
- Heijl A, Leske MC, Bengtsson B, Hussein M; Early Manifest Glaucoma Trial Group. Measuring visual field progression in the Early Manifest Glaucoma Trial. Acta Ophthalmol Scand. 2003;81(3):286-93. Available from: https://doi.org/10.1034/j.1600-0420.2003.00070.x
- Bengtsson B, Lindgren A, Heijl A, Lindgren G, Asman P, Patella M. Perimetric probability maps to separate change caused by glaucoma from that caused by cataract. Acta Ophthalmol Scand. 1997;75(2):184-8. Available from: https://doi.org/10.1111/j.1600-0420.1997.tb00121.x
- Arnalich-Montiel F, Casas-Llera P, Munoz-Negrete FJ, Rebolleda G. Performance of glaucoma progression analysis software in a glaucoma population. Graefes Arch Clin Exp Ophthalmol. 2009;247(3):391-7. Available from: https://doi.org/10.1007/s00417-008-0986-1
- Wilkins M, Fitzke F, Khaw P. Pointwise linear progression criteria and the detection of visual field change in a glaucoma trial. Eye (Lond). 2006;20(1):98-106. Available from: https://doi.org/10.1038/sj.eye.6701781