Figure 2
Outcome of Trabeculectomy in Advanced Glaucoma in a tertiary hospital in Rivers State, Nigeria
Awoyesuku EA* and Fiebai B
Published: 19 December, 2018 | Volume 2 - Issue 2 | Pages: 027-031

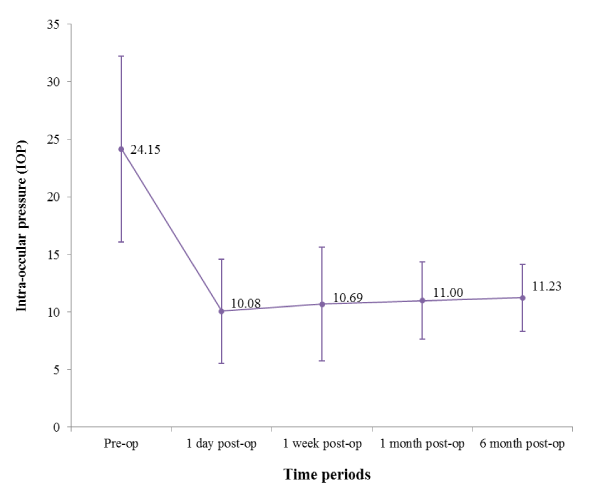
Figure 2:
Error bar chart showing mean IOP of respondents across the different time periods Friedman ANOVA= 23.392; p-value=0.001
Read Full Article HTML DOI: 10.29328/journal.ijceo.1001018 Cite this Article Read Full Article PDF
More Images
Similar Articles
-
A Comparative Study of Anatomic and Functional Outcomes of Two Surgical Techniques of Cataract at LomeAyena KD*,Santos KAM,Vonor K,Amedome KM,Wodome A,Strauss G,Nagbe YE,Koffi-Ametooyona A, Balo K. A Comparative Study of Anatomic and Functional Outcomes of Two Surgical Techniques of Cataract at Lome . . 2017 doi: 10.29328/journal.hceo.1001001; 1: 001-008
-
Efficacy of early Hyperbaric Oxygen Therapy in Central Retinal Artery OcclusionAyse Gul Kocak Altintas*,Mehmet Citirik. Efficacy of early Hyperbaric Oxygen Therapy in Central Retinal Artery Occlusion . . 2017 doi: 10.29328/journal.hceo.1001003; 1: 023-028
-
Intravitreal ranibizumab in the management of acute central serous ChorioretinopathyIbrahim Nawaiseh,Ahmad Halawa*,Dina Alardah. Intravitreal ranibizumab in the management of acute central serous Chorioretinopathy . . 2017 doi: 10.29328/journal.hceo.1001007; 1: 049-054
-
The management of Irvine-Gass Syndrome in a patient using Inhaler SteroidAyse Gul Kocak Altintas*,Cagri Ilhan,Mehmet Citirik. The management of Irvine-Gass Syndrome in a patient using Inhaler Steroid . . 2018 doi: 10.29328/journal.ijceo.1001011; 2: 001-005
-
Low vision due to persistent Cloquet’s canalAyse Gul Kocak Altintas*. Low vision due to persistent Cloquet’s canal . . 2018 doi: 10.29328/journal.ijceo.1001014; 2: 015-017
-
Is community based case detection of glaucoma relevant? Intraocular Pressure level and vertical Cup Disc ratio of participants at a screening programme in a rural setting in NigeriaElizabeth A Awoyesuku*,Ireju O Chukwuka. Is community based case detection of glaucoma relevant? Intraocular Pressure level and vertical Cup Disc ratio of participants at a screening programme in a rural setting in Nigeria . . 2018 doi: 10.29328/journal.ijceo.1001017; 2: 022-026
-
Outcome of Trabeculectomy in Advanced Glaucoma in a tertiary hospital in Rivers State, NigeriaAwoyesuku EA*,Fiebai B . Outcome of Trabeculectomy in Advanced Glaucoma in a tertiary hospital in Rivers State, Nigeria . . 2018 doi: 10.29328/journal.ijceo.1001018; 2: 027-031
-
Demographic pattern of refractive anomalies in Niger Delta presbyopes - Implications for preventive eye care practiceIreju Onyinye Chukwuka*, Chinyere Nnenne Pedro-Egbe. Demographic pattern of refractive anomalies in Niger Delta presbyopes - Implications for preventive eye care practice. . 2020 doi: 10.29328/journal.ijceo.1001025; 4: 005-008
-
Evaluation of the efficacy of transcorneal electric stimulation therapy in retinitis pigmentosa patients with electrophysiological and structural testsMualla Sahin Hamurcu*,Sema Akkan Aydogmuş,M. Sinan SARICAOĞLU. Evaluation of the efficacy of transcorneal electric stimulation therapy in retinitis pigmentosa patients with electrophysiological and structural tests. . 2020 doi: 10.29328/journal.ijceo.1001030; 4: 031-037
-
The evaluation of bandage soft contact lenses as a primary treatment for traumatic corneal abrasionsHashim Thiab Hassan*. The evaluation of bandage soft contact lenses as a primary treatment for traumatic corneal abrasions. . 2020 doi: 10.29328/journal.ijceo.1001032; 4: 041-048.
Recently Viewed
-
The surrey county lunatic asylum-an overview of some of the first admissions in 1863-1867Ruckshana Azeez*,Claire Veldmeijer,Paul Lomax,Aileen O’Brien. The surrey county lunatic asylum-an overview of some of the first admissions in 1863-1867. Arch Psychiatr Ment Health. 2022: doi: 10.29328/journal.apmh.1001039; 6: 023-028
-
Intrauterine Therapy with Platelet-Rich Plasma for Persistent Breeding-Induced Endometritis in Mares: A ReviewThiago Magalhães Resende*,Renata Albuquerque de Pino Maranhão,Ana Luisa Soares de Miranda,Lorenzo GTM Segabinazzi,Priscila Fantini. Intrauterine Therapy with Platelet-Rich Plasma for Persistent Breeding-Induced Endometritis in Mares: A Review. Insights Vet Sci. 2024: doi: 10.29328/journal.ivs.1001045; 8: 039-047
-
Gentian Violet Modulates Cytokines Levels in Mice Spleen toward an Anti-inflammatory ProfileSalam Jbeili, Mohamad Rima, Abdul Rahman Annous, Abdo Ibrahim Berro, Ziad Fajloun, Marc Karam*. Gentian Violet Modulates Cytokines Levels in Mice Spleen toward an Anti-inflammatory Profile. Arch Asthma Allergy Immunol. 2024: doi: 10.29328/journal.aaai.1001034; 8: 001-006
-
Unconventional powder method is a useful technique to determine the latent fingerprint impressionsHarshita Niranjan,Shweta Rai,Kapil Raikwar,Chanchal Kamle,Rakesh Mia*. Unconventional powder method is a useful technique to determine the latent fingerprint impressions. J Forensic Sci Res. 2022: doi: 10.29328/journal.jfsr.1001035; 6: 045-048
-
Digital Forensics and Media Offences – Investigate Synergy in the Cyber AgeGauri Goyal*. Digital Forensics and Media Offences – Investigate Synergy in the Cyber Age. J Forensic Sci Res. 2025: doi: 10.29328/journal.jfsr.1001074; 9: 015-020
Most Viewed
-
Feasibility study of magnetic sensing for detecting single-neuron action potentialsDenis Tonini,Kai Wu,Renata Saha,Jian-Ping Wang*. Feasibility study of magnetic sensing for detecting single-neuron action potentials. Ann Biomed Sci Eng. 2022 doi: 10.29328/journal.abse.1001018; 6: 019-029
-
Evaluation of In vitro and Ex vivo Models for Studying the Effectiveness of Vaginal Drug Systems in Controlling Microbe Infections: A Systematic ReviewMohammad Hossein Karami*, Majid Abdouss*, Mandana Karami. Evaluation of In vitro and Ex vivo Models for Studying the Effectiveness of Vaginal Drug Systems in Controlling Microbe Infections: A Systematic Review. Clin J Obstet Gynecol. 2023 doi: 10.29328/journal.cjog.1001151; 6: 201-215
-
Prospective Coronavirus Liver Effects: Available KnowledgeAvishek Mandal*. Prospective Coronavirus Liver Effects: Available Knowledge. Ann Clin Gastroenterol Hepatol. 2023 doi: 10.29328/journal.acgh.1001039; 7: 001-010
-
Causal Link between Human Blood Metabolites and Asthma: An Investigation Using Mendelian RandomizationYong-Qing Zhu, Xiao-Yan Meng, Jing-Hua Yang*. Causal Link between Human Blood Metabolites and Asthma: An Investigation Using Mendelian Randomization. Arch Asthma Allergy Immunol. 2023 doi: 10.29328/journal.aaai.1001032; 7: 012-022
-
An algorithm to safely manage oral food challenge in an office-based setting for children with multiple food allergiesNathalie Cottel,Aïcha Dieme,Véronique Orcel,Yannick Chantran,Mélisande Bourgoin-Heck,Jocelyne Just. An algorithm to safely manage oral food challenge in an office-based setting for children with multiple food allergies. Arch Asthma Allergy Immunol. 2021 doi: 10.29328/journal.aaai.1001027; 5: 030-037

HSPI: We're glad you're here. Please click "create a new Query" if you are a new visitor to our website and need further information from us.
If you are already a member of our network and need to keep track of any developments regarding a question you have already submitted, click "take me to my Query."


